
SHI 9.13.23 — Charge It!

SHI 9.6.23 – Reading the Signs
September 6, 2023
SHI 9.27.23 – WOOF
September 28, 2023
Tesla superchargers now number 50,000.
Which is pretty amazing, considering the fact that the first supercharger opened on September 24, 2012. Actually, 6 stations opened that day … along Interstate 5 to make Tesla trips from LA to San Francisco possible. And now, just slightly over 10 years later, Ford, GM, Honda, Nissan, Mercedes, Polestar, Rivian and Volvo have all announced they will all use Tesla superchargers beginning in 2024. A staggering achievement for Tesla.
“
Is Tesla the electric car winner?“
“Is Tesla the electric car winner?“
Perhaps, perhaps not. They are certainly far ahead, with an almost 60% market share today. But that will likely change over time. There are numerous competitors all vying for market share. Many from China. Time will tell.
But they have probably won the charging wars. Their extensive global supercharger network is likely to become the de facto electric car standard … just as Kleenex did for tissues and Google did for internet search. If you don’t believe me, just google Kleenex. 🙂
But other ‘charging‘ wars rage on … as we see below.
Welcome to this week’s Steak House Index update.
If you are new to my blog, or you need a refresher on the SHI10, or its objective and methodology, I suggest you open and read the original BLOG: https://www.steakhouseindex.com/move-over-big-mac-index-here-comes-the-steak-house-index/
Why You Should Care: The US economy and US dollar are the bedrock of the world’s economy.
But is the US economy expanding or contracting?
Expanding … FED rate increases notwithstanding! At the end of Q2, 2023, in ‘current-dollar‘ terms, US annual economic output rose to an annualized rate of $26.84 trillion. After enduring the fastest FED rate hike in over 40 years, America’s current-dollar GDP still increased at an annualized rate of 4.7% during the second quarter of 2023. Even the ‘real’ GDP growth rate was strong … clocking in at the annual rate of 2.4% during Q2. No wonder the FED is concerned.
The world’s annual GDP first grew to over $100 trillion in 2022. According to the IMF, in June of this year, current-dollar global GDP eclipsed $105 trillion! IMF forecasts call for global GDP to reach almost $135 trillion by 2028 — an increase of more than 28% in just 5 years.
America’s GDP remains around 25% of all global GDP. Collectively, the US, the European Common Market, and China generate about 70% of the global economic output. These are the 3 big, global players. They bear close scrutiny.
The objective of this blog is singular.
It attempts to predict the direction of our GDP ahead of official economic releases. Historically, ‘personal consumption expenditures,’ or PCE, has been the largest component of US GDP growth — typically about 2/3 of all GDP growth. In fact, the majority of all GDP increases (or declines) usually results from (increases or decreases in) consumer spending. Consumer spending is clearly a critical financial metric. In all likelihood, the most important financial metric. The Steak House Index focuses right here … on the “consumer spending” metric. I intend the SHI10 is to be predictive, anticipating where the economy is going – not where it’s been.
Taking action: Keep up with this weekly BLOG update. Not only will we cover the SHI and SHI10, but we’ll explore “fun” items of economic importance. Hopefully you find the discussion fun, too.
If the SHI10 index moves appreciably -– either showing massive improvement or significant declines –- indicating growing economic strength or a potential recession, we’ll discuss possible actions at that time.
The Blog:
Tesla is not the only thing charging these days.
CHARGING UP
Consumer debt is supercharged too. We all know credit card balances blew past $1 trillion last quarter. However, you may not have know is this tidbit, courtesy of NY FED ‘household debt’ press release on August 8th:
“Compared to other debt categories this quarter, credit card balances saw the most pronounced worsening in performance, following a period of extraordinarily low delinquency rates during the pandemic.”
That’s right. Not only are Americans now carrying more than $1 trillion in credit card balances, delinquencies rates are increasing as well. Consider the chart below, courtesy of the NY FED:
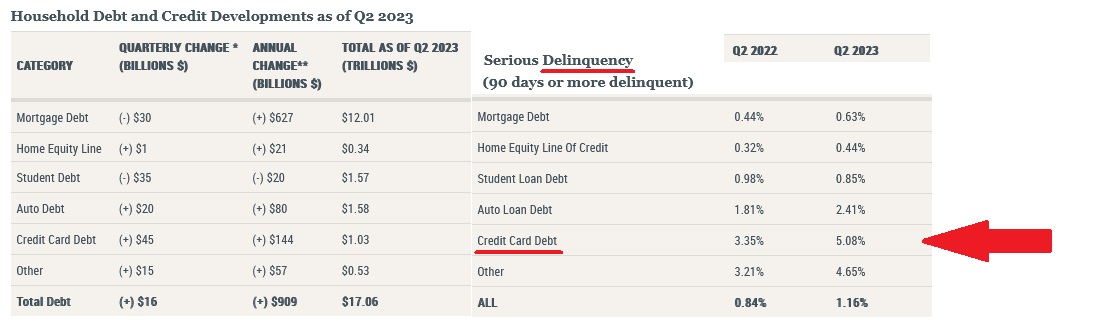
Of course, I added the red lines and red arrow. On the left side of the chart, you can see that in the prior year, credit card debt balances increased by $144 billion — an increase of over 16%. In 1 year.
That’s a big increase. And one that is certain to become a drag on consumer spending as 2023 progresses. Remember: The average credit card interest rate is currently above 20%.
At the end of Q1 this year, the delinquency rate on credit card debt was 3.35%. The red arrow shows that level jumped significantly in Q2 — over 5% now. Again, this is not a good sign for the American consumer.
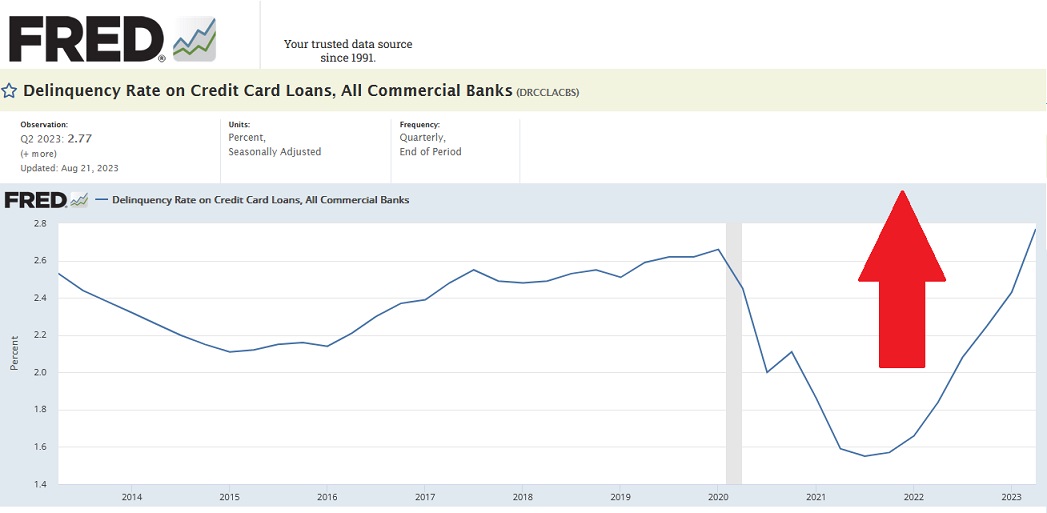
It’s worth commenting the NY FED data reflects more consumer stress than FRED. Over at the St. Louis FED, they report a lower delinquency rate, but the upward trend-line is obvious. In fact, today’s 90-day delinquency rate is the worst since just after the ‘Great Recession of 2008’ — more than 10 years ago.
CHARGING HIGHER
On the other hand — come on, you knew there was always going to be another hand — the net worth of Americans, again in the aggregate, has never been higher:
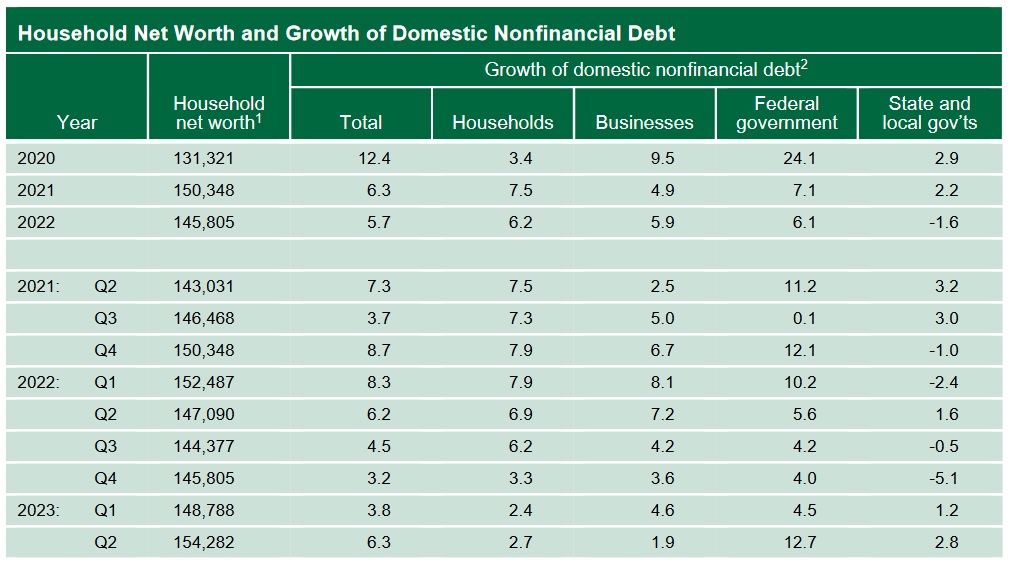
Sure debt levels are up, but so is household net worth, according the the Federal Reserve’s quarterly Z.1 report. As of the end of Q2, 2023, American household net worth was greater than $154 trillion. Of course, this report fails to consider income and wealth inequalities within the system. Most of the net worth belongs to the upper two income quartiles. But regardless, American household net worth, in the aggregate, is charging up. Ultimately, for the economy as a whole, the resulting ‘wealth effect’ is a good, solid economic tailwind.
CHARGING AHEAD
And then we have to consider the updated ‘nowcast’ reports.
The Atlanta FED updated their GDPNow forecast on September 8th. They still predict Q3 ‘real’ GDP at 5.6%. I remain amazed and skeptical. I cannot believe this growth rate forecast.
On that same date – September 8th – the New York FED jumped back into the forecasting game. They had exited during the pandemic. Their new approach is interesting and their forecast growth rate is much lower than over in Atlanta. Take a look at their chart and forecast:
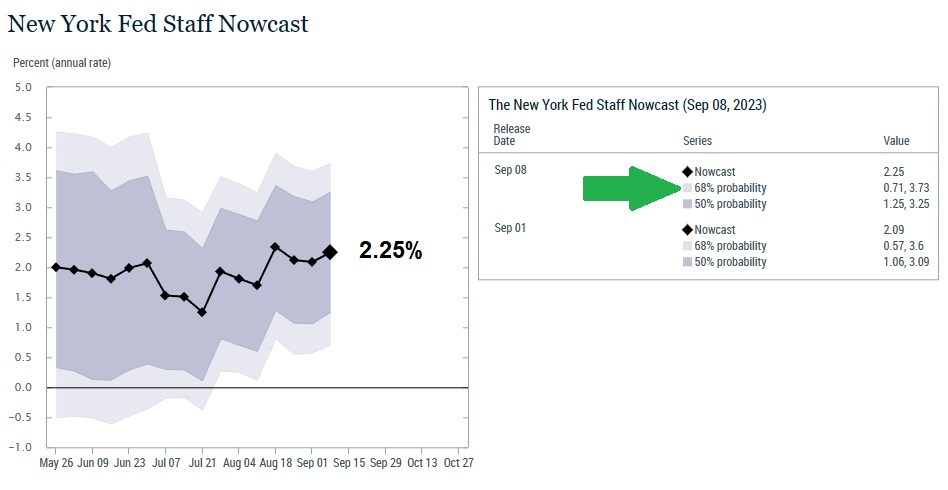
The black line represents their “best guess” for the ‘real’ Q3 GDP growth rate. Now, take a look at the box to the right. See that green arrow? They have added probability ratings to their new forecast methodology. As you can see, they feel there is a 68% probability the growth rate will range between 0.71% on the low end to as high as 3.73% on the high. Both, of course, are a far cry from 5.6%. And remember: These are ‘real’ numbers — the ‘current-dollar’ growth rate will be higher by the rate of inflation.
CHARGING A LOT
Which brings us full circle to steaks. I just returned from New York City where my wife and I visited Gallagher’s for a scrumptious steak dinner. I’m hoping I can write off the dinner and trip as “market research,” because our Gallagher’s “dinner-for-2” alone exceeded $500. It was excellent … but, boy, do they charge a lot. And they are almost always packed! They were certainly packed to the gills the evening we were there.

This coming Saturday is no exception: Gallagher’s is full — while reservations at the other three SHI restaurants are almost wide open. Crazy.
Here’s the longer term trend chart:
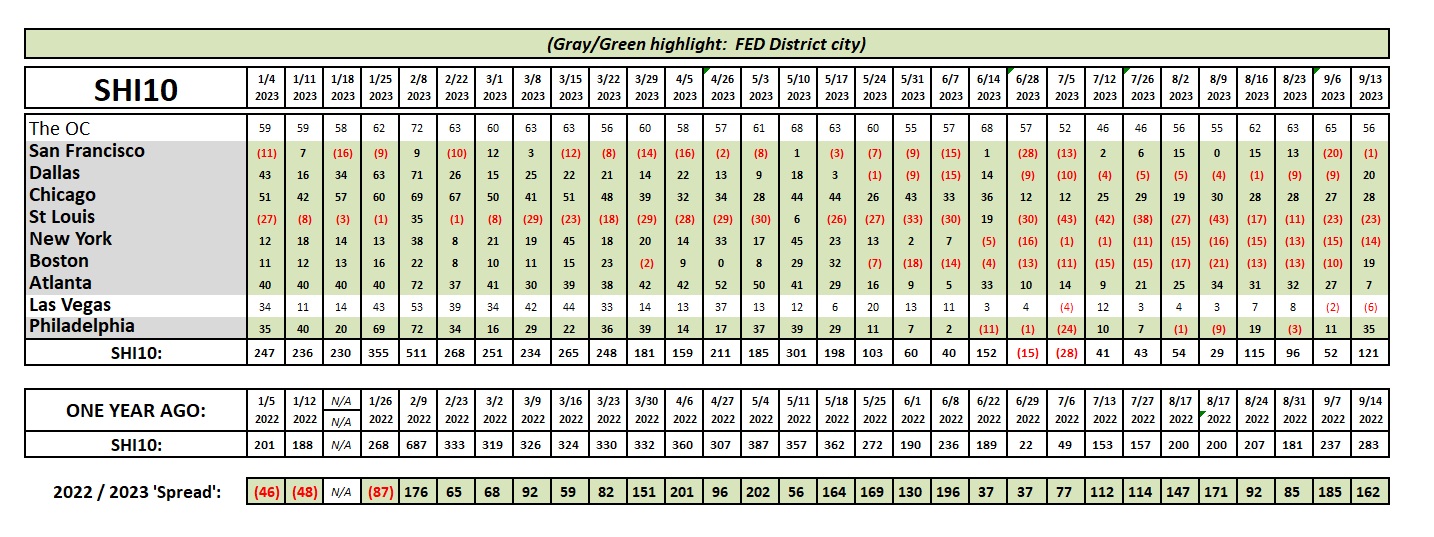
Reservation demand improved this week over last, but demand is nowhere as robust as earlier in the year. Take a closer look at the “Spread” numbers. Essentially, a red number suggests reservation demand — for that week — was stronger in 2023. A black number, that demand was stronger in 2022. Clearly, reservation demand is down in 2023.
As always, data conflicts. Credit card balances and delinquencies, as well as the SHI10, imply a slowing economy. Household wealth accumulation and the ‘nowcast’ forecasts both bode well for GDP growth. The simple fact is that both can be true simultaneously. That works.
A reminder: No SHI next week. I know. S O O O O O O O O disappointing. What will you do for entertainment? Where might you find an alternative riveting, current, pithy economic commentary?
The answer, of course, is “just about anywhere else.” So thank you for tuning in. I appreciate my dedicated and committed 6 blog readers.
🙂
<“:”> Terry Liebman


