
SHI 7.29.20 – Did Someone Mention Gold?

SHI 7.22.20 – The Earth is Flat Once Again
July 22, 2020
SHI 8.5.20 – Is an Inflation Wave Heading our Way?
August 5, 2020
Oh. Right. I did. In last week’s blog post. 🙂
Well, since we’re on the topic, what the heck is driving UP gold prices? I mean, the price of a ‘troy oz’ of gold is on a tear!
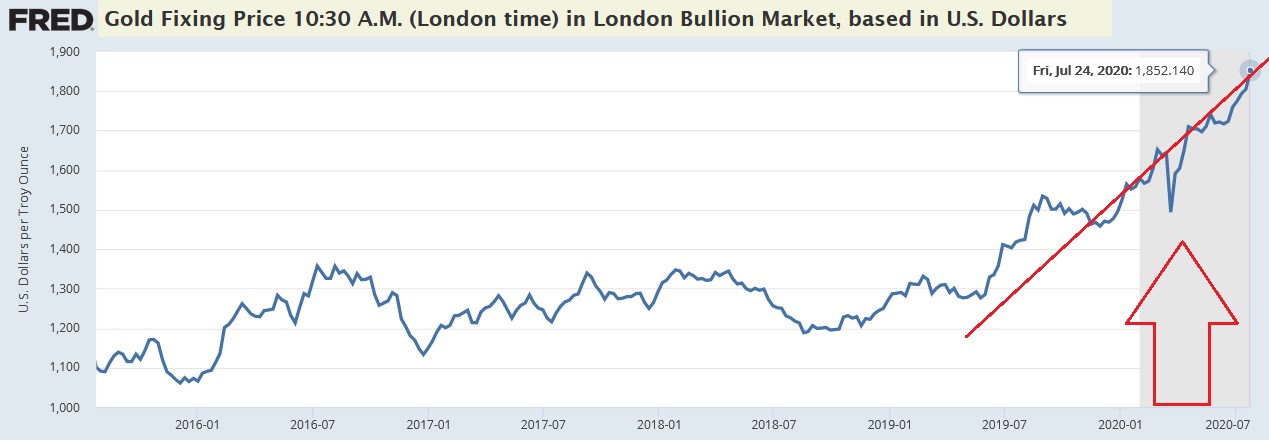
On 1/1/16, the “per ounce” price of gold was $1,065. Around a thousand bucks. At the end of last week, as you can see above, that price had lifted to over $1,852. That’s a 74% price increase. More recently, from its March 20th low-point of $1,494 per oz, the price is up by almost 24%! What’s going on … why are …
” Gold prices up 24% in 4 months? “
Like most economic mysteries, this issue offers varying perspectives. For example, if you ask a ‘Gold Bug,’ he or she would tell you the answer is simple: INFLATION! Rampant inflation is just around the corner! Perhaps. But I don’t think the answer is quite that simple. Other short answers might be:
- A decline in the value of the US dollar against a basket of global currencies.
- A significant increase in US dollar money supply compared to the relatively fixed supply of gold in the world.
Both of which are also valid replies. But like most mysteries, this one is not simple. The questions are more nuanced, the possible answers, more complex:
- Does global fiscal stimulus increase global money supply?
- What are the economic impacts of a growing money supply simultaneous with declining levels of GDP?
- Can an increased rate of money supply growth trigger higher inflation rates over time?
- What impact might money supply expansion have on asset values?
Welcome to this week’s Steak House Index update.
If you are new to my blog, or you need a refresher on the SHI10, or its objective and methodology, I suggest you open and read the original BLOG: https://www.steakhouseindex.com/move-over-big-mac-index-here-comes-the-steak-house-index/
Why You Should Care: The US economy and US dollar are the bedrock of the world’s economy.
But is the US economy expanding or contracting?
Before COVID-19, the world’s annual GDP was about $85 trillion today. No longer. It will shrink thanks to ‘The Great Lockdown.’ I did not coin this phrase — the IMF did. The same folks who track global GDP. Until recently, annual US GDP exceeded $21.7 trillion. Again, no longer. But what has not changed is the fact that together, the U.S., the EU and China still generate about 70% of the global economic output.
The objective of this blog is singular.
It attempts to predict the direction of our GDP ahead of official economic releases. Historically, ‘personal consumption expenditures,’ or PCE, has been the largest component of US GDP growth — typically about 2/3 of all GDP growth. In fact, the majority of all GDP increases (or declines) usually results from (increases or decreases in) consumer spending. Consumer spending is clearly a critical financial metric. In all likelihood, the most important financial metric. The Steak House Index focuses right here … on the “consumer spending” metric. I intend the SHI10 is to be predictive, anticipating where the economy is going – not where it’s been.
Taking action: Keep up with this weekly BLOG update. Not only will we cover the SHI and SHI10, but we’ll explore related items of economic importance.
If the SHI10 index moves appreciably -– either showing massive improvement or significant declines –- indicating growing economic strength or a potential recession, we’ll discuss possible actions at that time.
The BLOG:
The price of gold is up. Way up. As you read this blog, the price is very near $2,000 per ounce. This is an all time high. What’s driving the price? And what might this phenomenon be telling us about the rest of the economy, other asset values, and the future? Let’s dive in.
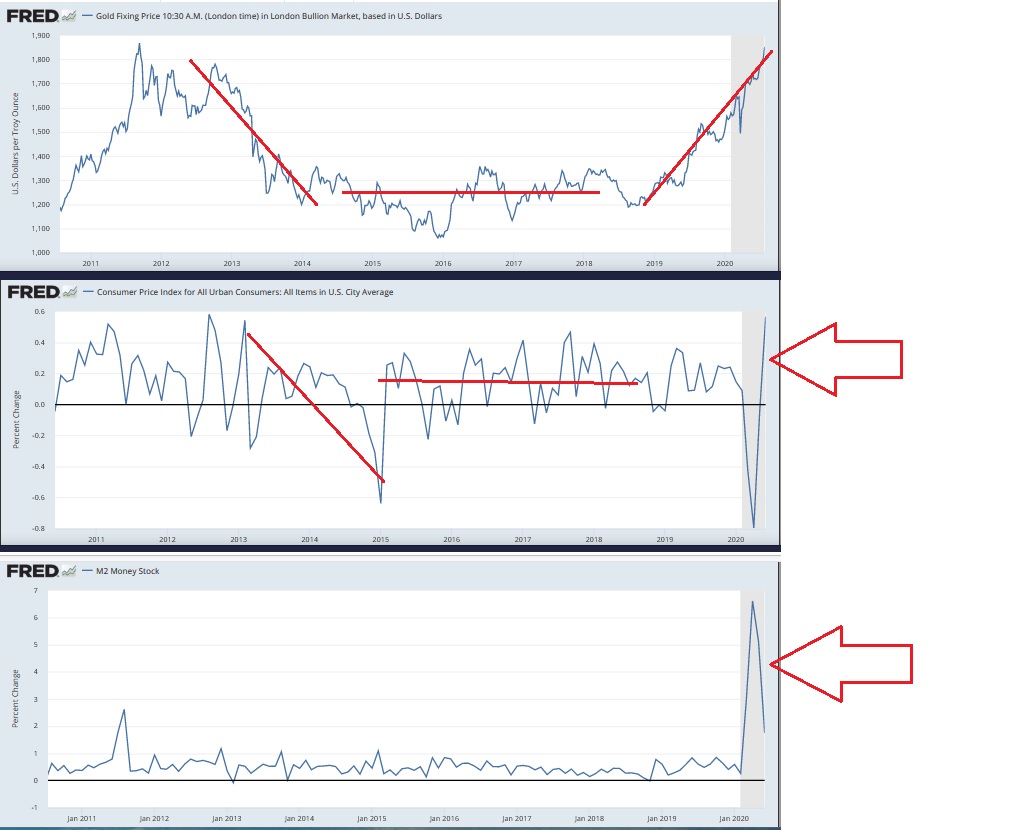
Look at the top chart below. We saw similar gold price movements during the FEDs quantitative easings following the Great Recession. When the recession began in late 2007, the price was about $800. The price more than doubled before reaching its recent top in September of 2011 at around $1,820 per ounce. And then fell to about $1,000 per ounce in the next 4 years, remaining within a limited trading range for a few more years, before beginning its climb once again in early 2019. The image below bracketed by the red lines I’ve added looks like a valley. But going further back in time, to the beginning of this century, gold’s price was quite a bit lower. In fact, in January of 2000, gold traded at near $280 per ounce.
The second and third charts both reflect PERCENTAGE CHANGE from the preceding period. In the second chart, we see that the per-oz price of gold has been highly correlated with quarter-over-quarter changes in CPI over the same period. When the percentage change in CPI was declining, the gold price did the same. When the CPI change was flat, gold was flat. But this relationship seems to have changed in 2019. Why?
We see from the third chart the answer is not an increased money supply. In fact, month-over-month percentage changes in M2, over the past 10 years, have been quite consistent. That is, right up to February of 2020, when money supply growth exploded. So in the past 10 or so years gold saw price declines, a flat bottom, and then rose again beginning in 2019. Reasons aside, the facts are clear: the price of gold has almost doubled. in the past 10 years. And the price is up over 700% since the year 2000. Why? What is gold telling us? Should we be listening to the message?
Yes. We should listen. Here are my reasons.
Gold is in a class of unique assets. Supply growth is very limited and the asset is very popular. Gold has been mined for about 6,000 years, but the vast majority of the current stockpile was extracted from the ground in the last 50-60 years. While the growth in the quantity of gold in circulation has increased over time, the increase has been exceptionally small when compared to the growth of most other things … such as population, economies, inflation, and other asset prices. The World Gold Council (WGC) estimates that all the gold ever extracted from the earth equals about 190 thousand metric tons. Other estimates are lower. Gold mining continues today, but the folks over at the WGC estimate that just 30% of what’s already been mined remains in the ground. At least when viewed thru the lens of (1) reasonably accessible and (2) at a reasonable cost. But as gold’s price increases, so does what is considered reasonable.
Regardless, the point here is that gold supplies are not elastic. They will grow, but gold’s growth rate is compared to other asset classes, we see gold’s growth rate is a small fraction by comparison. And then we have to consider the uses of gold. No, gold doesn’t only sit in the vaults at Central Banks. It is used for:
- Jewelry manufacturing
- Industrial fabrication (electronics, dental, medical, and other)
- Retail investment (gold coins and gold bars)
All of which consumes much of the gold mined annually and “scrapped” (recycled). I think this image will help. Note the vertical bars reflect the quantity of gold consumed, on a quarterly basis, over the past 10 years — by all sources — and the gold line reflects the changing price of gold.

The color of each use corresponds to a vertical bar on the chart. Here’s the point: Each year, of the 3,000 metric tons of gold produced, the majority of it is “used.” Gone. Only a small portion is “saved” by central bankers and investors. Thus, while the supply of gold does increase, it increases very slowly.
Summarizing, gold facts are unique:
- Supply is quite static and inelastic.
- Demand is consistent.
- Growth in supply is exceptionally low, when compared to other assets.
Which means the price of gold offers us a unique yardstick by which to measure other assets. Under the assumption that the per oz price of gold is a meaningful yardstick, and that significant price changes, over long periods of time, are suggestive and meaningful, we simply need to figure out what the price movement means. Let’s consider three measurements. First, the price increase of over 7X during the past 20 years. Second, the near doubling of the per oz price in the last 10 years. And, finally, the 24% value increase in the past year of so. We have three data points. All showing significant movement over time. And all up significantly.
There is another way to consider this picture. Imagine, for a moment, that the ‘value’ of gold is actually unchanged. Meaning that the 20-year, 10-year, and 1-year moves in value — in dollar terms — is actually zero. I know this is a reach … but work with me here for a moment. This line of thought reminds me of that iconic scene from the movie The Matrix, where Neo is watching the small boy “bend” the spoon using only his mind. The boy comments, “Do not try to bend the spoon. That’s impossible. Instead … only try to realize the truth. There is no spoon. Then you’ll see that it is not the spoon that bends, it is only yourself.” Like the bend-a-spoon episode, this is a mind exercise. We have to bend our perception to understand what might be happening below the surface. And here is what I think is going on beneath the surface.
During the 1960’s the US fought a very expensive war in Vietnam, funded by a rapidly expanding monetary base. Eventually, this triggered an inflationary cycle and ushered in a new economic chapter, now known as ‘Monetarism‘, championed by the Nobel economist Milton Friedman, with this iconic statement in 1970:
“Inflation is always and everywhere a monetary phenomenon in the sense that it is and can be produced only by a more rapid increase in the quantity of money than in output.”
Essentially, Friedman believed that if money supply grew faster than GDP, ever increasing inflation would be the result. And his forecast proved true. During the 1970s the inflationary cycle that began about 10 years (or more) earlier picked up steam. Eventually, about 10 years later, this reality forced the then Federal Reserve Chairman Volcker to radically raise interest rates with the singular purpose of taming inflation once and for all. It was a bold move, and it threw the country into a deep recession, but it worked. By 1990, inflation was tamed. And remains under control today.
During this same 50+ years, the US became the home of the largest economy on the planet. And the US dollar became firmly entrenched as the global reserve currency. Today, most foreign exchange transactions happen in dollars, and many countries around the world issue dollar denominated debt. At present, the US dollar is, for all practical purposes, the world’s currency. For this reason, and a whole host of others, our monetary base has increased commensurately. And, as it turns out, the price of gold — priced in dollars — has followed the same general pattern as the US monetary base:
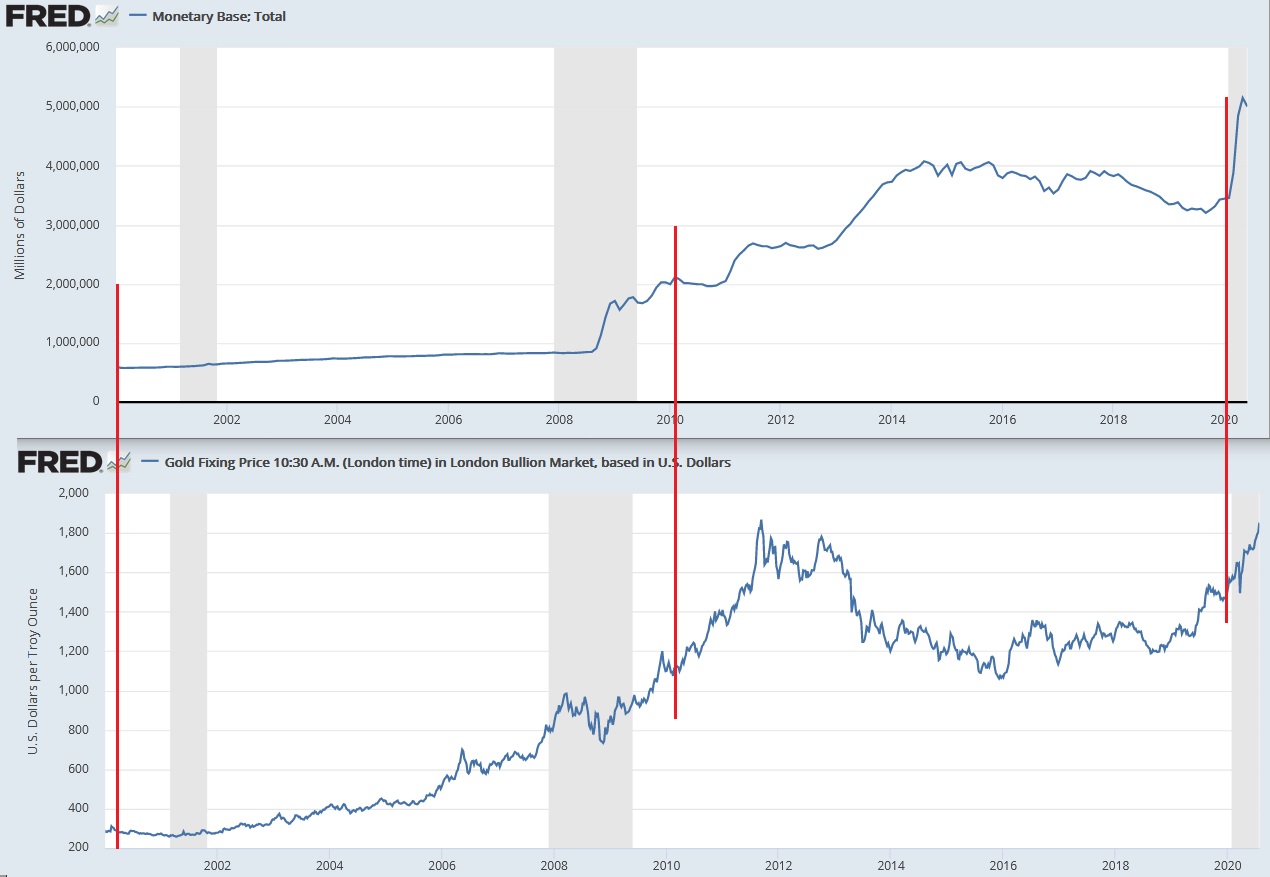
Now, consider the underlying data:
- In January of 2000, the ‘monetary base’ was 601,686. Gold was about $280 per oz.
- In January of 2010, the monetary base (MB) had increased to almost 2,000,000. Gold’s price was now about $1,100 per oz. The MB had increased 328%. Gold, 390%.
- In June of 2020, the monetary base (MB) had increased to almost 5,000,000. Gold’s price was now about $1,950 per oz. The MB had increased 830% since 2000. Gold’s per oz price is up by about 700% during the same period.
Notice the trend? No, the movement is not perfectly correlated. But consider this: The per ounce price of gold is almost unchanged if we price it using the year 2000 monetary base. While the monetary base has increased more than 8X, the gold supply has increased by a minuscule percentage in comparison. The supply of gold, for all practical purposes, has been nearly static over the past 20 years.
The global monetary base is exploding due to the global response to Covid-19. Major central banks around the world are injecting QE at levels never seen before. Here in the the US, the FEDs balance sheet is already up by more than $3 trillion. Toss in a couple trillion in Japan and Europe, and we see a jaw-dropping increase in central bank asset balances:
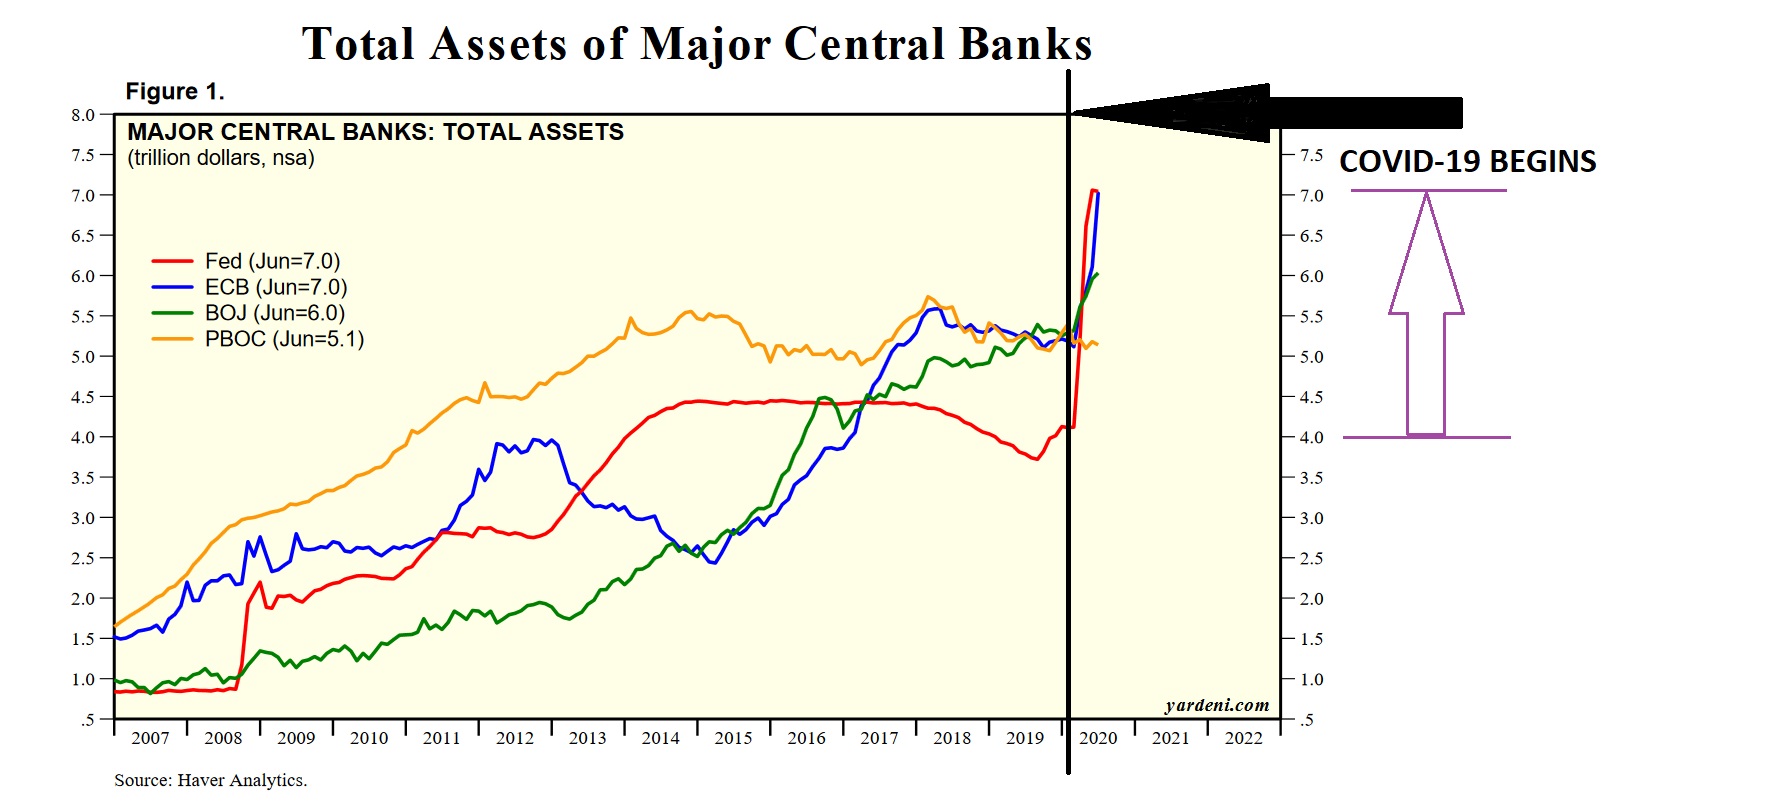
Many financial experts expect the QE to continue, and before the end of 2021, many are estimating the FEDs balance sheet will eclipse $10 trillion. Other central banks are expected to keep pace.
The money supply now being created by central banks is only eclipsed in amount by fiscal stimulus here in the US and abroad in Europe and the other major economies. According to the Bank for International Settlements (BIS), trillions of dollars, amounting to to more than 10% of combined global GDP, has been — or will be — injected into the global economy. In dollar terms, let’s assume the final number is close to $10 trillion. Combined central bank QE plus government’s fiscal stimulus, therefore, is likely to exceed $20 trillion before this episode is behind us. The US monetary base is rising at a very rapid pace. Which, in my opinion, is the reason why gold, when measured in dollar terms, is increasing rapidly.
Will this trigger another inflationary spiral? Perhaps. This is a great question and debate, but I’ll save this discussion for another blog.
I do believe, however, that all this added liquidity, this sloshing lake of new capital, will drive up asset values. Significantly. At the same time, ultra-low interest rates will drive actual, and expected yields, even lower…ever closer to zero, and perhaps below. Under these conditions, the possibility for “Dow 100,000” within the next 10 years becomes a serious reality. Why? For the same reason the dollar-price of gold is rapidly escalating. Unlike gold, other assets can and do grow in quantity each year. Their supply expands as conditions promote expansion. Thus, the expansion of the monetary base will not trigger the same value increase I expect we will see in gold. But I feel we will see a sizable overall asset value increase due to this massive monetary base increase. Again, think of it this way: The expanding monetary base simply suggests that underlying asset value really has not changed … it simply takes more of the expanding dollar pool to buy the same asset. Make sense?
Impossible? Well, consider what happened during the 1980s. The “year high” for the DJIA in 1980 was 1,000. The year high in 1990 was 2,999.75. That’s a 300% increase in 10 years. This could happen again … for much of the same reasons. The bottom line: In this environment, over the next few years, cash will become less valuable and all other asset classes (with notable Covid-19 challenges and disruptions noted) will become more valuable. Possibly by 2X or 3X in the next 10 years. Here’s the bottom line:
Invest in something. Gold. Stocks. Real estate. Get to it. The time is now. 🙂
By the way, the information below was reported earlier this week by Johns Hopkins:
“A 2-dose candidate SARS-CoV-2 vaccine developed by Moderna, Inc. and the US National Institute of Allergy and Infectious Diseases (NIAID), mRNA-1273, will begin Phase 3 clinical trials today (Monday). Trial participants will include approximately 30,000 healthy, adult volunteers at 89 clinical research sites in the US. Sites chosen include those that are predicted to be emerging COVID-19 hotspots as well as areas that already have sustained community transmission. Doses will be given via intramuscular injections 28 days apart, but the researchers are hopeful that there will be evidence of immunity following the first dose. The trial will be double-blind, randomized, and placebo-controlled. If fewer than 150 participants develop COVID-19 of the 30,000 enrolled, the trial will be considered a success by trial organizers.”
Other Phase 3 clinical trials are now pending, too. I believe we will have a viable vaccine candidate by the end of August. This is good.
– Terry Liebman


