
SHI 8.17.22 – Welcome to the Real World

SHI 7.30.22 — Oops!… I Did It Again
July 30, 2022
SHI 8.24.22 – From FOMO to FOOP
August 24, 2022
… said Morpheus to Neo in ‘The Matrix.‘ Welcome to the real world indeed.
Because the ‘real’ world isn’t actually “real” – economically speaking. The real world — the world we live in — is nominal. Or ‘current-dollar’ as my long-term readers know. The ‘real’ world only exists in some federal statistics and measurements like GDP. We don’t live or shop in the ‘real’ world. We live and shop in the current-dollar world.
“
Inflation-adjustments won’t pay your rent …”
“Inflation-adjustments won’t pay your rent …”
… nor will they help you buy a house. Because home prices are never quoted in ‘real’ – or inflation adjusted – prices. They quoted in current-dollars. How about cars? Are car prices quoted as inflation adjusted? Groceries? Gas? No. None of them. When you or I shop for, and buy, new stuff, we pay the current-dollar price. We never, ever pay an inflation adjusted price. And that’s because we don’t carry inflation-adjusted dollars in our wallets or bank accounts. No, we have the same, old dollars we’ve always had. They’re just worth less. No, I didn’t say worthless – I said worth less. 🙂
Welcome to this week’s Steak House Index update.
If you are new to my blog, or you need a refresher on the SHI10, or its objective and methodology, I suggest you open and read the original BLOG: https://www.steakhouseindex.com/move-over-big-mac-index-here-comes-the-steak-house-index/
Why You Should Care: The US economy and US dollar are the bedrock of the world’s economy.
But is the US economy expanding or contracting?
Expanding. Maybe. At the end of Q2, 2022, in ‘current-dollar’ terms, US annual economic output rose to $24.85 trillion. Yes, during Q1, the current-dollar GDP increased at the annualized rate of 7.8%. The world’s annual GDP rose to about $95 trillion at the end of 2021. America’s GDP remains around 25% of all global GDP. Collectively, the US, the euro zone, and China still generate about 70% of the global economic output. These are the 3 big, global players.
The objective of this blog is singular.
It attempts to predict the direction of our GDP ahead of official economic releases. Historically, ‘personal consumption expenditures,’ or PCE, has been the largest component of US GDP growth — typically about 2/3 of all GDP growth. In fact, the majority of all GDP increases (or declines) usually results from (increases or decreases in) consumer spending. Consumer spending is clearly a critical financial metric. In all likelihood, the most important financial metric. The Steak House Index focuses right here … on the “consumer spending” metric. I intend the SHI10 is to be predictive, anticipating where the economy is going – not where it’s been.
Taking action: Keep up with this weekly BLOG update. Not only will we cover the SHI and SHI10, but we’ll explore “fun” items of economic importance. Hopefully you find the discussion fun, too.
If the SHI10 index moves appreciably -– either showing massive improvement or significant declines –- indicating growing economic strength or a potential recession, we’ll discuss possible actions at that time.
The Blog:
Welcome back! Thank you … it’s good to be back! OK, to the blog.
Real GDP fell the annual rate of 0.9% in the second quarter. By this measure, the US economy contracted. But did it? In my book, the answer is no. The economy actually expanded in Q2. The text below appeared in the Q2 report, directly from the BEA:
“Current‑dollar GDP increased 7.8% at an annual rate, or $465.1 billion, in the second quarter to a level of $24.85 trillion.”
An increase of 7.8% sounds a lot like an expansion to me. Right? So why is everyone worried about recession? Because by the traditional ‘real’ metric used by the BEA for decades, the US economy did contract during both Q1 and Q2. But this is one time when I feel the traditional metrics fail to capture the true spirit of the data.
The simple fact is that the whopping inflation rate — while really HIGH and truly a bad, bad thing — is aberrationally high due to non-economic factors. Factors like pandemics, pestilence and war. Of course a few components are truly troublesome — things like rent. These cannot be ignored or explained away by the pandemic. But in my opinion, the majority of the CPI spike can be attributed directly to the events that began in early 2020.
“Salaries have not kept up with inflation.” You’ve probably heard that quote quite a bit in the past few months. This fact is absolutely true — if talking about ‘real’ salaries. They have not. In fact, adjusted for inflation, wages and salaries are down about 3.5% in the past year. In this case, we’re talking about ‘real’ wages, not current-dollar wages. Perhaps I’m redundant here, but let me say this another way: While current-dollar wages are up about 5.2% in the preceding 12 months, before adjustment for inflation – an important adjustment for policy purposes, the general inflation-adjusted level of wages is down.
But here’s an interesting question for you to consider: Once the inflation rate falls – yes, I continue to believe it will – whether by FED efforts or other means – will wage growth rates also decline? Consider this scenario for a moment.
Inflation pushes prices up. Not all things, but many. Once the inflation growth rate recedes back to its 2% target, more or less, will prices actually fall? No. Generally, this is not likely. The prices of some stuff will fall, but no, price levels will be higher. And they are likely to remain there. Consider this example: Are homes generally cheaper today than they were 25 years ago? How about cars, apartment rents and New York steaks? No. None are cheaper. Prices went up and stayed up. The rate-of-change in price is what slowed. Or stopped. When the rate-of-change becomes zero, general price levels remain static. General price declines only occur in deflationary environments. For example, in Japan between 1990 and 2010.
Right now, here in the US, the cost of many consumer items is quite a bit higher than a year ago. The price we pay – the current-dollar price – for food, clothing, homes, rents, gas, cars, Big Macs, hotel rooms, plane tickets, and so on, is up. In a high-inflation environments, prices rise and continue to rise month after month, quarter after quarter, year after year. This is common in many developing nations around the globe.
But not here in the US. Or anywhere else in the developed world, for that matter. No, the elevated inflation rate we’re experiencing right now is episodic and unusual. Don’t misunderstand me: Inflation itself is a chronic condition, it’s today’s exceptionally high rate of consumer inflation that is quite unusual.
And here’s the rub: The “price of labor” is far less dependent on the inflation rate than the supply/demand relationship for labor. It’s worth repeating that over the past 50 or so years, labor as a percentage of the input cost in manufacturing has declined significantly. This impacts the “demand” side of the equation. Ironically, of late, as the JOLTs reports show, demand is quite strong: Job openings have never been higher.
The “supply” side of the equation is more impacted by demographic trends and things like labor-participation rates. This pandemic clearly impacted the supply-side of labor. Labor participation rates and the size of the civilian labor force have both fallen precipitously post-pandemic. Unfortunately, another extremely key component has really exacerbated the problem.
Historically, legal immigration to America has provided critical, foundational support to the supply-side of the labor equation. For generations, immigration fueled the growth of our labor force and propelled GDP growth ever higher. As you know, almost all of us are related to people who came here from other countries across the globe. As the graph from The Economist below demonstrates, this trend continued until early 2019, when it dramatically reversed:
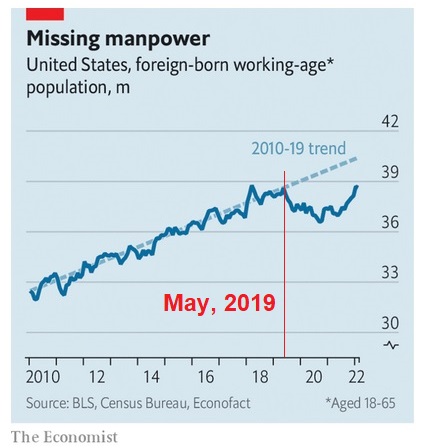
As this is not a political blog, I’ll let you figure out what caused the reversal.
This graph was compiled using data compiled by two economists at UC Davis. They estimate that by February of 2022, America was “missing” about 1.8 million working-age foreign migrants relative to the post 2010-trend. Employers in the “restaurant and accommodation” sector, which draws 25% of its employees from the foreign-born population, could not fill about 15% of job openings last year. In “professional and business services,” where the foreign-born make up a fifth of workers — everything from architectural sketches to tax preparation — roughly 10% of jobs went unfilled last year. Those outcomes, they suggest, may be contributing to higher wages. I agree.
As America’s “natural” population growth slowed after 2010, new immigrants accounted for nearly 70% of the growth in the American labor force in the 2010s.
And since the current US fertility rate is below the level needed to even maintain the current US population, over the next two decades, immigrants are likely to be the only source of growth for the civilian labor force. The Pew Research Center estimates that without new arrivals America’s labor force would decline to 163 million in 2040 from 166 million in 2020. However, alternatively, if net immigration were to return to pre-2019 levels, the labor force would instead grow to 178 million by 2040.
For years, America feared new-arriving immigrants would “crowd out” naturalized citizens. Today, I fear the opposite is true.
Post-pandemic, it’s been noted that the US labor force is “missing” around 3 to 4 million people. Recall that in a civilian labor force of about 166 million people, this missing 2% to 3% is a big deal. Remember: the unemployment rate is only 3.5%. If a magic wand could make all the missing people instantly reappear, the unemployment rate would be closer to 6%. These folks would go a long way to solving the excess labor demand problem highlighted in the JOLTs report. In fact, inasmuch as the long-term “job openings” tend to hover around 5 million people, magically adding 4 million people to the labor force would fill a significant portion of the 10.7 million “openings.”
“The Great Resignation” has struck a chord in the media, is one tag for the problem. But like everything else today, it’s not that simple. More than a million are chronically missing due to child-care issues. Another million – or more – have retired either due to age or desire. Finally, the graph suggests almost two million legal immigrants never joined our labor force due to restrictions and processing-slowdowns both pre and post-pandemic. Add up the losses due to child care issues, the demographics of retirement, and a constricted pipeline of legal immigrant workers, and we have a serious “supply” problem. One that will not be solved over time by a growing US population, inasmuch as our nation’s fertility rate is now far below the level needed to simply maintain our current population – let alone increase it. We have a very serious supply problem that will plague our economy for years unless it is fixed. Which is so ironic in a country where the streets are paved with gold. How can a country with gold in the streets have trouble locating high-quality immigrants willing to come over and pick it up?
More than 100 years ago, the rumor that American streets were “paved with gold” spread faster than Covid amongst potential legal immigrants looking for a better life for themselves and their families. Today, Ellis Island has an exhibit entitled “Streets Paved With Gold” celebrating the legal immigrants who helped build America all those decades ago. Without those contributions to the American labor force, would the United States be the economic powerhouse it is today? I think not.
It’s worth noting that the current conditions would be far worse if labor’s share of output had remained at historic levels:
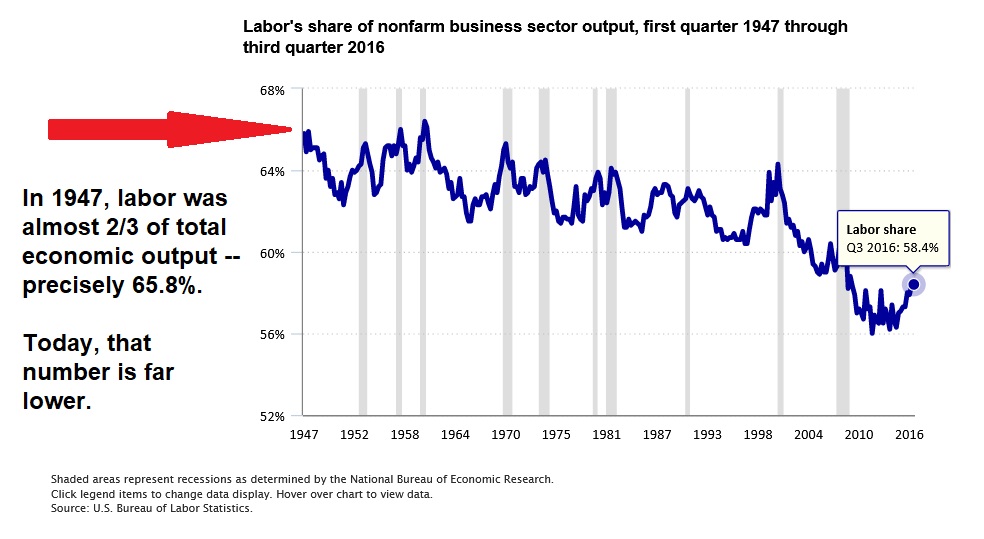
In the past 6 decades, labor’s share of output has shrunk significantly … meaning other “means of production” have been substituted for labor. Things like automation, robots, etc. Had labor demand remained consistent, today’s supply shortfall would be far more intense.
As I said earlier, the issue is quite complex. While the “price” of labor is directly impacted by the supply vs. demand relationship, both the supply-side and the demand-side are always in flux. Today, demand is strong and supply is constrained. Thus, the “price” companies are generally willing to pay is up. Is this “wage inflation?” What is wage inflation? Have you heard that term? Is it a meaningful metric?
No. The term wage inflation is a simplification, designed to help understand increasing wage environments. Wage inflation is a “general increase in the amount people earn over time.” Which is not a bad thing, right? Right. Unless it, too, gets out of control. Which, ironically, is one of the FEDs current concerns.
Ironically, if inflation rates are low, and wage growth is faster than consumer price increases, many will suggest that “wage inflation” will keep the inflation rate high. This is an absurd simplification in that wage inflation is the result of a labor supply/demand imbalance, nothing more sinister. Today’s wage inflation is a result of supply/demand imbalances … not caused by higher inflation rates. This wasn’t always the case … but I’ll leave that rabbit hole for another day.
So now we’re full-circle back to the original discussion above about inflation and wages, both ‘real’ and ‘current-dollar.’ Wages are paid in current-dollars … just as products are priced. There is no inflation adjustment in anything except government statistics.
At the same time, while many economists like to point out that inflation-adjusted wage gains have lagged behind the current inflation rate, the simple fact is that the two issues are not directly related. In other words, they are more independent of each other than reliant on (correlated with) each other. Increasing inflation rates can happen simultaneously with decreasing current-dollar wages. Fortunately, that hasn’t happened this time, as current dollar wages have increased 5.2% in the past year. But, sure, that increase is lower than the current rate of inflation.
After the inflation rate heads lower, however, the current-dollar wage gains will remain. Meaning that the general level of wages will be up and remain up for the foreseeable future. In fact, it’s quite possible that in the next 12 months or so — given the general labor shortages — wage gains will significantly exceed the rate of inflation!
If inflation were to suddenly turn negative, would employers demand wage cuts from their staff? Could they? Probably not. The fact is that longer-term, wage levels and employment levels are more directly correlated with economic expansions and contractions than inflation. Don’t get me wrong. All these things are ingredients in our American economic soup, and each had impacts on the other; however, economic growth is the biggest driver of labor demand and labor costs over time. And the opposite is also true.
After inflation is tamed, will labor costs, too, decline? Well, that’s actually a trick question. For two reasons. First, as I just said, the price of labor is more heavily impacted by the supply/demand balance than the inflation rates. And secondly, because once again, it’s not the cost of labor that will decline it is the rate-of-change in wages and salaries that will likely slow over time, as the supply/demand relationship realigns.
Unless the FED absolutely destroys our economy, with crazy-excessive rate increases, it’s quite likely that the current growth rates in wages will continue well after the inflation rate reverts to its 2% mean. Which means that current-dollar wages will likely continue to grow even as prices level off. If you’re an employer, I’m sorry to share this bad news. But if you’re an employee, break out your party hat! Good times! ?
In the real world, it’s important to understand causal economic relationships. The media has done a dismal job explaining this one. Not only do they perpetually fail to explain the difference between ‘real’ and ‘current-dollar’ numbers, often misquoting the data, but they continuously suggest there is a high degree of correlation and causal relationship between inflation and wage growth. There is some, because both are in the soup so to speak, but the relationship is tangential at best.
And one of the quickest ways to solve American’s civilian labor force shortage is to welcome high-quality, hard-working immigrants to our shores where they can hopefully find a better life and their own pots of gold.
Shall we head to the steak houses where gold AMEX cards are accepted, and gold coins are not?
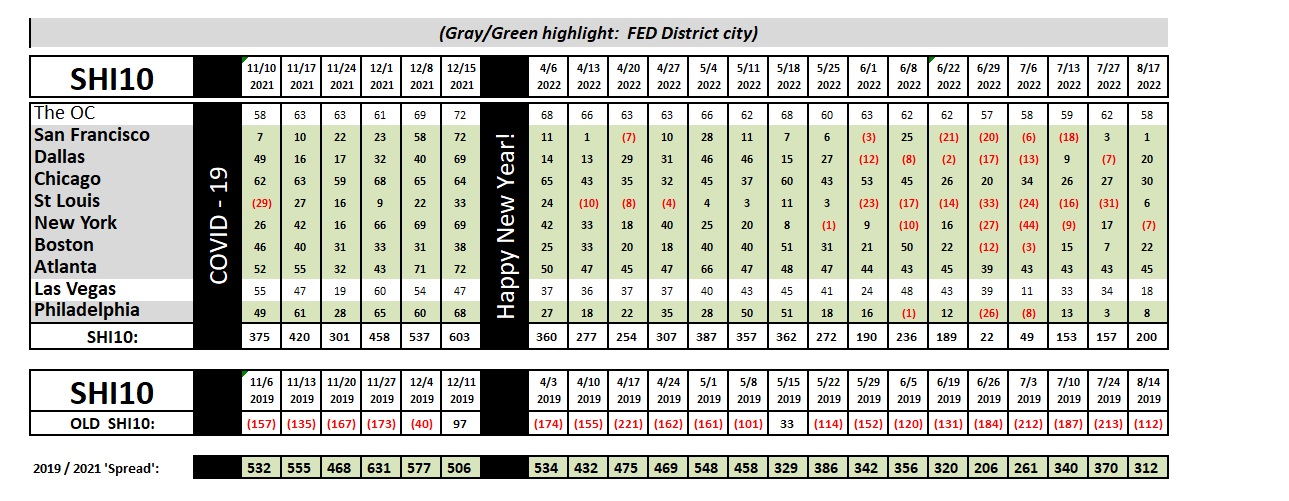
This week, 8 of our 10 SHI markets showed significant increases in reservation demand. Since our June-swoon low of 22, the SHI10 has regained quite a bit of ground. Expensive steaks are in high demand once again!
Or, perhaps, they always were. The two rather low readings in late-June and early-July may prove to be the outliers. Time will tell. But it’s easy to see that expensive eatery reservations for this Saturday next are in short supply. Here are the individual restaurant results:
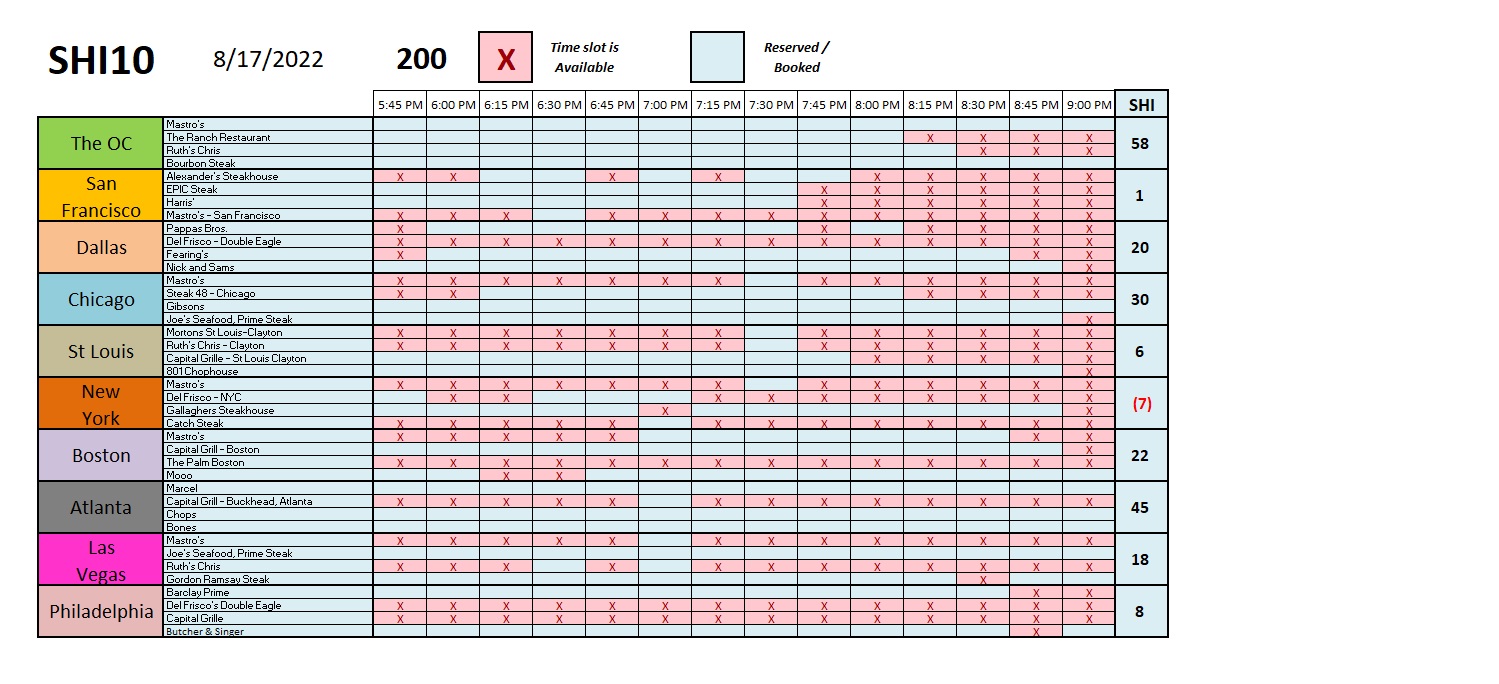
Demand remains robust. Steaks and steakhouses are sizzling. I’m guessing the FED will raise rates a bit more.
<:> Terry Liebman


