
SHI Update 12/21/16: Merry MacroEconomic Xmas!

SHI Update 12/14/16: The FED Speaks
December 14, 2016SHI Update 12/28/16: Confidence Reigns!
December 28, 2016Good news: The “Trump Rally” is real! Better news: You did not miss it! Dow 20,000 may simply be a milestone we pass as we see much higher stock prices in years to come!
Read on for the facts and opinions you may worth considering. Welcome to this week’s Steak House Index update.
As always, if you need a refresher on the SHI, or its objective and methodology, I suggest you open and read the original BLOG: https://terryliebman.wordpress.com/2016/03/02/move-over-big-mac-index-here-comes-the-steak-house-index/)
Why You Should Care: Should you invest in the stock market? Now? As the DOW dallies with historic highs? There are very good reasons to believe 20,000 may look cheap a few years from now. Let’s take a look at when and why.
Taking Action: Do you have money in the stock market? No? Consider getting in. Yes? Consider increasing the size of your positions.
In either case, consider ultra-low fee ‘index’ funds like Vanguard’s VTSAX (expense ratio: 0.05%) or iShares IVV (expense ratio: 0.04%). (Disclosure: I have owned IVV for a number of years.)
(Further disclosure: Remember, these are my opinions only. Many experts feel the market is significantly over-valued. They may be right… Please become educated on these opposing opinions before making any investment decision. These are my opinions only.)
The BLOG: This is a fact: the value of an asset is some function of its income. A company’s stock value is both constrained and determined by this relationship.
A stock’s ‘price-earnings’ ratio reflects this relationship. Meaning the price of the stock is some multiple of its earning. Earnings, in this case, refers to a company’s ‘net income’ – the amount left after all expenses and taxes. If taxes go DOWN, earnings go UP.
The price-earnings ratios, or the PE ratio, therefore is simply a stock’s price divided by it’s earnings. Suppose a stock’s price is $15 per share and it’s earnings are $1 per share. This equals a PE ratio of 15 – close to the average over many decades.
Of course, PE ratios fluctuate wildly. Sometimes plummeting corporate earnings – perhaps due to a recession – cause PE ratios to temporarily spike. Other times, investor exuberance may lift PE ratios….perhaps based on a strong belief that corporate earnings will grow significantly in the future. Here’s a great historic PE chart, courtesy of Dr. Robert Shiller:

The general level of interest rates and dividend yields impact PE ratio. It’s easy to see (above) the inverse correlation between general interest rate levels and PE ratios. Lower rates, over a protracted period, will tend to elevate the general level of PE ratios.
What is the current PE ratio for the Dow and S&P 500? Take a look, courtesy of the WSJ:

At about 22 and 25, respectively, today’s PE ratios are quite high by historic standards. Which begs the question: Are the stock markets overvalued? Perhaps. There’s no doubt they are IF corporate income does not rise significantly over the next few years – as the financial markets expect – it is. Absolutely.
However, right now, among other things stock and bond investors are betting the Trump administration will push corporate expenses lower thereby driving earnings sharply higher. And there’s a very good chance they’re right. Why?
Two reasons: Lower corporate taxes and reduced regulation are both vanguards of the Trump plan. Both have the effect of reducing cost and increasing corporate net income. Let’s take a look at taxes.
While the Trump administration and the Senate disagree a bit on the desired 2017 corporate tax rate (15% vs. 20%), collectively they have the power to make a change. From Trump’s website (https://www.donaldjtrump.com/press-releases/fact-sheet-donald-j.-trumps-pro-growth-economic-policy-will-create-25-milli):
“The plan lowers the business tax rate to 15%. The current business rate 35% rate is one of the highest in the world, making domestic investment unattractive. The plan also allows U.S.-based manufacturers to elect full expensing of plant and equipment, an invitation to massive investment. If they elect this approach, they will give up the ability to deduct interest expense.“
And the potential impact of this change is big. Along with their GDP statistics, the BEA provides a quarterly update on corporate profits. (https://www.bea.gov/newsreleases/national/gdp/2016/pdf/gdp3q16_2nd.pdf)
Crunching the data from Table 11: Corporate Profits, we find that while the statutory tax rate is 35%, the effective corporate tax rate is lower:
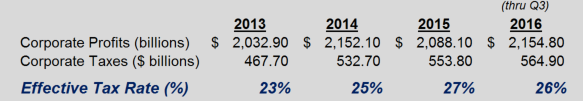
Recalculating the PE ratios from the chart above using a “revised tax rate” of 15%, both are about 10% lower – or 20 and 22, respectively.
The trade-off between interest deductability vs. deducting capital expenditures (CapEX) is interesting. It also has the potential to increase corporate spending and profitability. Tax policy drives behavior. Suppose companies stop repurchasing stock and instead pay down debt…while also increasing deductable CapEX. CapEX today drives profits of tomorrow. This, too, is a proven fact.
The Regan decade offers some insight. What happened to stock values during the 1980s?
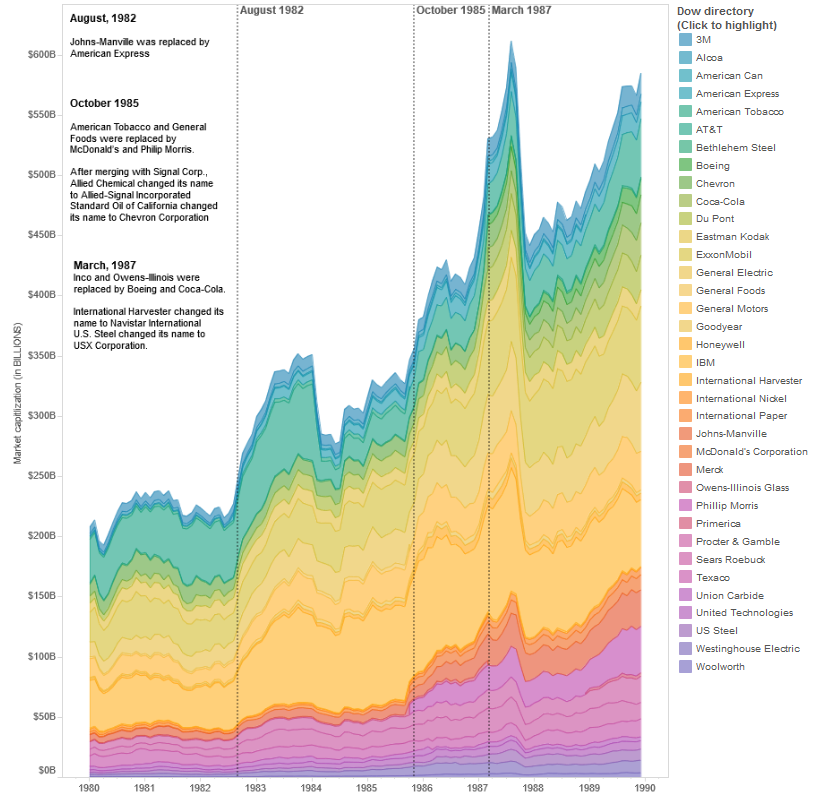
It’s easy to see the ‘value’ of the DOW30 increased from about $200 billion in 1980 to almost $600 billion at the end of 1989 – when Reagan’s term ended. A 3X market value increase.
What drove this massive value increase? Was the catalyst … :
- Growth in corporate profits?
- GDP growth?
- Declining interest rates?
- Inflation correlated?
- Demographic?
Probably all of the above. Could we see a 3X increase in the next 10 years?
I doubt it. Let me summarize with these comments. Today’s financial and economic conditions do not mirror the 1980s. GDP growth, interest rates, inflation and demographics are vastly different today.
But there similarities. Reducing corporate taxes and government ‘red tape’ will boost corporate profitability. Increased CapEX will boost corporate profitability.
How much? Well, as with all things, that depends on what actually changes we see during 2017 in corporate tax rates, tax regulation, and red tape. If the expected and forecasted changes don’t occur, and we don’t see a meaningful increase in corporate profits, there’s a good chance stock prices will receed – perhaps sharply. But there is plenty of legitimate expectation to support the current stock price levels – and even higher levels depending on what actually happens during the next 4 years of the Trump administration.
Shall we see if the Steak House Index is showing similar exuberance?
It absolutely is! Saturday nite is “Christmas Eve” and – wow! – apparently no one is staying home! Even the Capital Grille is feeling the Christmas spirit: It’s COMPLETELY BOOKED thru 8:15! Be still my heart! Here’s the 3-week running chart:

With an SHI reading of positive 57 this week, there can be no longer be any doubt: While the SHI is a reflection of overall economic strength, the holiday season is definitely spiking demand. Perhaps next year we’ll have to impose a “seasonal adjustment” to December numbers. If January reflects a post-Holiday SHI ‘hangover’ of weak SHI readings, we’ll definitely talk more on this concept.
Here’s this weeks ‘trend’ report:

(A quick shout out to Ron LaRosa: Thanks for the ‘edit’ – I’ve fixed the error in the chart above!)
Well, regardless of the catalyst, steakhouses are bursting at the seams Saturday night. Cows beware!
The US economy is strong; consumer spending is robust; the future looks bright!
Merry Christmas Capital Grille! Happy Holidays to all!
- Terry Liebman


