
SHI Update 12/14/16: The FED Speaks

Balance of Trade, Globalization and Protectionism
December 11, 2016SHI Update 12/21/16: Merry MacroEconomic Xmas!
December 21, 2016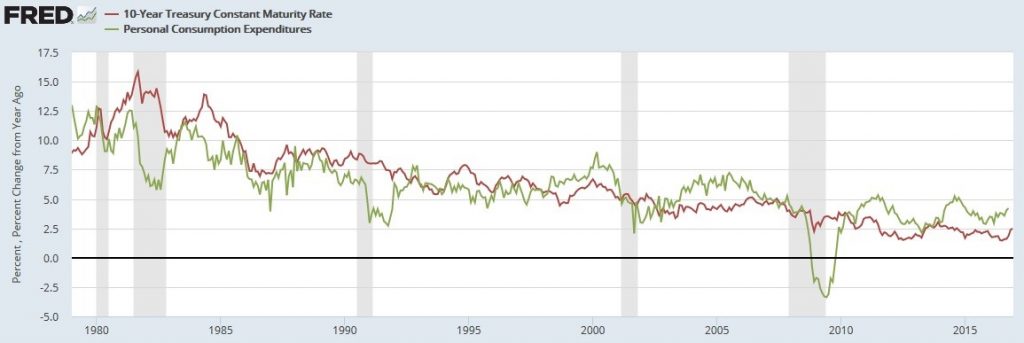
In prior BLOGs, I’ve discussed the concepts of ‘correlation‘ and ‘causation.’
Two events occurring simultaneously, or almost synchronous, doesn’t guarantee a link between the events. Their proximity in time and/or place may be circumstantial.
But the ‘correlation’ and ‘causation’ relationship between inflation (or inflation expectations) and interest rates is undeniable:

The red line above is the 10-year Treasury yield. The green, the annual change in the PCE (the FEDs inflation metric.) In the rear-view mirror, the relationship between inflation and interest rates is clear. This has always been the case.
There is no doubt: if inflation decides to come out of hibernation, interest rates will soon rise. So, is inflation back?
Welcome to FED DAY and this week’s Steak House Index update.
As always, if you need a refresher on the SHI, or its objective and methodology, I suggest you open and read the original BLOG: https://terryliebman.wordpress.com/2016/03/02/move-over-big-mac-index-here-comes-the-steak-house-index/)
Why You Should Care: The US economy towers over all others: our GDP is over $18.5 trillion a year. Is it growing or shrinking?
The objective of the SHI is simple: To predict the direction of this behemoth. But while the objective is simple, the task is not.
BEA publishes GDP figures the instant they’re available. Unfortunately, it is a trailing index. The data is old news; it’s a lagging indicator. We know how the economy is doing in advance of the GDP release.
Personal consumption expenditures, or PCE, is the single largest component of the GDP. In fact, the majority of all GDP increases (or declines) usually result from consumer spending. Thus, this is clearly an important metric to track.
I intend the SHI is to be predictive, anticipating where the economy is going – not where it’s been. Thereby giving us the ability to take action early. Not when it’s too late.
Taking action: Keep up with this weekly BLOG update. If the SHI index moves appreciably – either showing massive improvement or significant declines – indicating expanding economic strength or a potential recession, we’ll discuss possible actions at that time.
Inflation? See below.
The BLOG: In a word, no, inflation is not back. Yes, it is trending upward…

… but it remains quite muted at 1.41% per year in October. We started the year with 1.0% annual PCE inflation…it’s little changed today. (Recall the FED has a ‘target’ of 2% per year.)
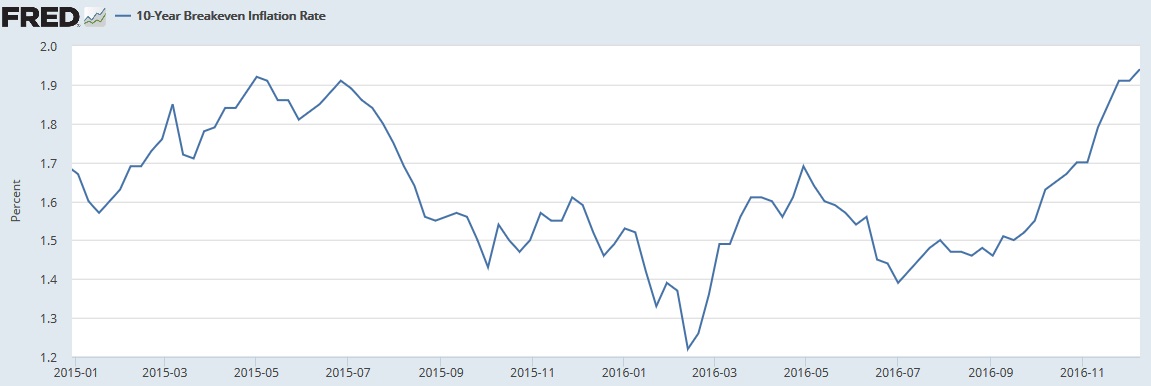
Shifting the discussion to “expectations,” the financial markets have an interesting inflation barometer. Called the “10-year Breakeven Inflation Rate“, it represents a measure of expected inflation derived from the difference between the 10-Year “constant maturity” Treasury (CMT) and and 10-Year Treasury Inflation-Indexed (TIPS). Subtract the 10-year TIPS yield from the 10-year CMT yield, over time, and you get the graph below:
Said another way, when considering a 10-year Treasury investment, an investor with $10,000 has a choice:
- On one hand, that investor can buy a 10-year Treasury. As I write this blog, the annual rate of return is fixed at 2.44%. When 10 years are up, the US Treasury return $10,000 to the investor.
- Or that same investor can purchase a 10-year ‘inflation protected security‘ Treasury – known as a ‘TIPS’ – which has a current yield 0.53%. But TIPS have a kicker: The amount returned to the investor in 10 years increases each year by the inflation rate. Assume we have an inflation rate (CPI) of 1.50%. In this case, after one year the investor received his/her 0.53% return AND the principal value of his/her security increased to $10,150.
Thus, every long term US Treasury security investor can make a choice: Do I “lock in” my return, or should I gamble and purchase a TIPS.
The “10-year Breakeven Inflation Rate” (BIR) indicates the yield – at any moment in time – where an investor considers either decision to be about equal.
On Feb 12 of this year, the BIR was 1.22%. Today it sits at 1.94%. Which means US financial markets now believe the inflation rate over the next 10 years will be 0.72% higher than they expected earlier this year.
Remember: This is an investor inflation expectation. Not a reflection of current, actual conditions.
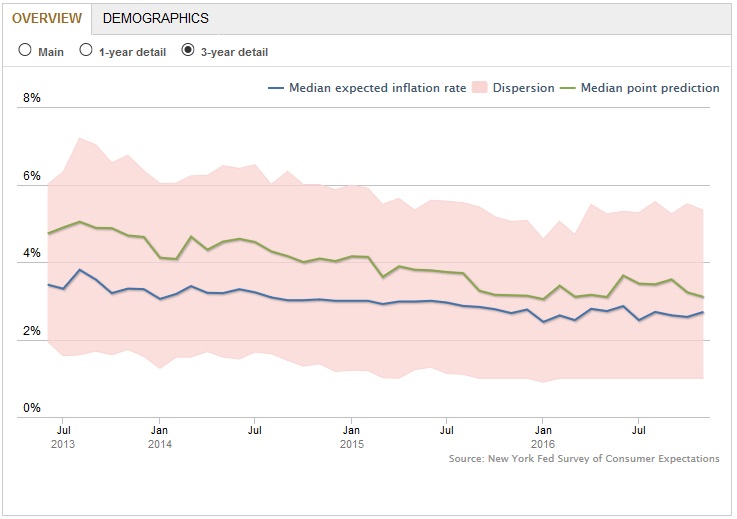
Consumers also have an inflation expectation.
Last week the NY FED released their “Survey of Consumer Expectations.” Here is the overview chart:
In addition to their “Consumer Confidence” survey, the University of Michigan also asks consumers about their inflation expectation. Here are the results:
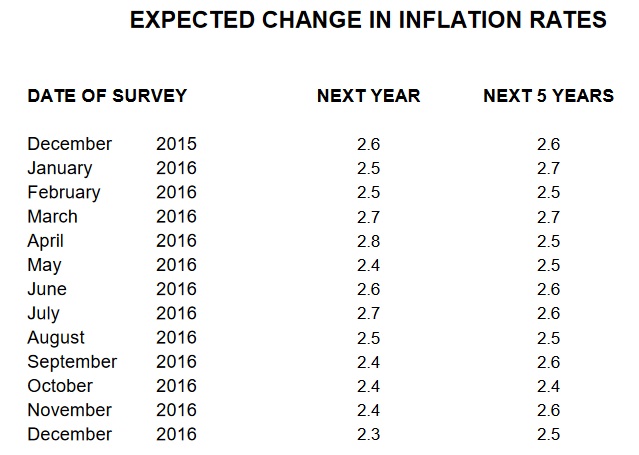
It’s interesting to note that while investors are expecting a meaningful inflation rate increase, consumers surveyed by both the NY FED and the University of Michigan do not.
Wage growth is potentially a big inflation driver. If consumer inflation expectations remain muted, I suspect their wage demands will do the same.
The bottom line: Inflation has picked up a bit. But I feel it is premature to forecast a longer-term increasing trend (as the financial markets seem to be).
At 11:00 am today, the FED raised short-term rates by .25%. As expected. There is no surprise here, and content in their press release is consistent with my comments above:
“Market-based measures of inflation compensation have moved up considerably but still are low; most survey-based measures of longer-term inflation expectations are little changed, on balance, in recent months.”
Here is the FEDs crystal-ball for 2017 and beyond:

All of which translates to NO PRICE CHANGE for our steaks! Which is good news … as they’re already pretty darn expensive!
But this week, once again, they’re in huge demand. Once again, we’re not eating at Mastros on Saturday. OpenTable reported, “No tables are available within 2.5 hours of your 7:00 PM request.” Wow.
Today’s SHI reading is an impressive positive 21. Following a +10 reading from two weeks ago, and a +13 from last week, this is a very bullish consumer spending statement!

Of course, the SHI could be experiencing the “Christmas Effect,” right? Office parties? Employee appreciation dinner? Perhaps. But I don’t think so. Here’s the long term trend chart:

Finally, let me finish with a graph. The blue line below reflects the actual movement in the SHI. The red line, a 3-month moving average. By either metric, consumer spending in our high-priced eateries is definitely heading up!
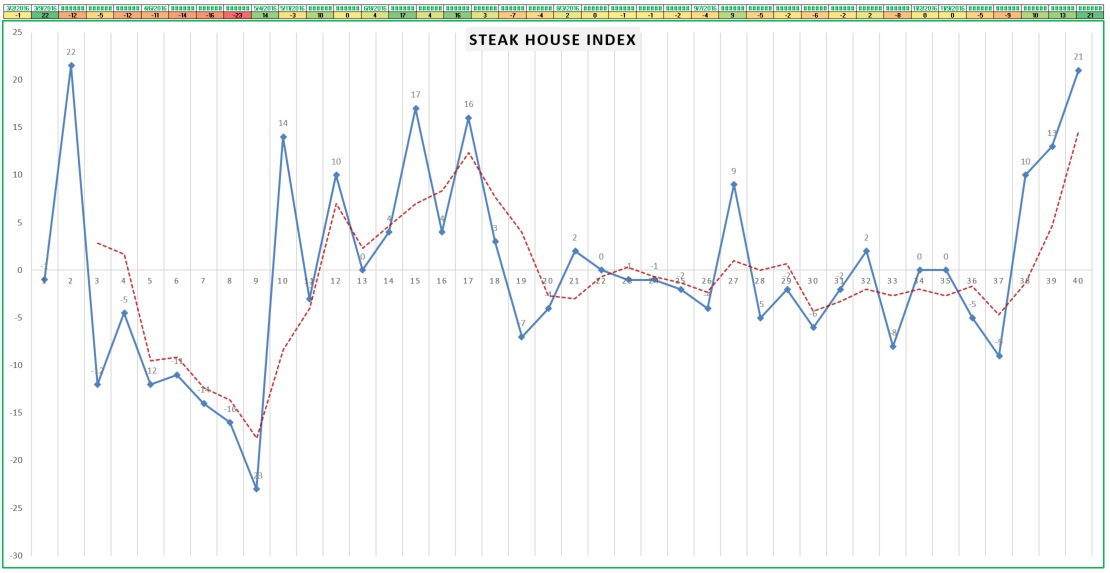
The SHI is indicating very strong consumer demand. This suggests our economy remains on solid footing; the Q-4 GDP reading, by this measure, should be strong.
- Terry Liebman


2 Comments
hey there and thank you to your information – I’ve definitely picked up anything new from right here. I did alternatively experience some technical points using this website, as I experienced to reload the website many times prior to I could get it to load properly. I have been thinking about if your hosting is OK? Not that I am complaining, however slow loading circumstances occasions will often have an effect on your placement in google and can damage your quality score if ads and ***********|advertising|advertising|advertising and *********** with Adwords. Well I am including this RSS to my email and could look out for much extra of your respective exciting content. Ensure that you replace this again very soon..
One place you re extremely unlikely to notice the Fed rate increase is in your savings account.