SHI Update 3/22/17: Safe Houses
March 22, 2017SHI Update 4/5/17: Consumer Spending
April 5, 2017
French fries go with steak, right?
Sure. Of course, you won’t find fries on the menu at our lofty-priced eateries…there you can choose between Twice Baked or Scalloped – and don’t forget the delectable Lobster Mac and Cheese.
Nor will you hear about the April 23rd French presidential election. You’ll only get that here, with your weekly Steak House Index update! Welcome.
As always, if you need a refresher on the SHI, or its objective and methodology, I suggest you open and read the original BLOG: https://terryliebman.wordpress.com/2016/03/02/move-over-big-mac-index-here-comes-the-steak-house-index/)
Why You Should Care: The US economy and US dollar are the bedrock of global economics. This has been true for decades…and notwithstanding plenty of predictions to the contrary, it will continue to play this role for years to come. Fear not.
Nominal global GDP is about $76 trillion. US GDP is almost $19 trillion. Is it growing or shrinking? If it’s growing … how rapidly? How might this information impact our daily financial and business decisions?
The objective of the SHI is simple: To predict the GDP direction ahead of official economic releases. While the objective is simple, the task is not. BEA publishes GDP figures the instant they’re available. Unfortunately, the data is old, old news; it’s a lagging indicator.
‘Personal consumption expenditures,’ or PCE, is the single largest component of the GDP. In fact, the majority of all US GDP increases (or declines) usually result from (increases or decreases in) consumer spending. Thus, this is clearly an important metric to track.
I intend the SHI is to be predictive, anticipating where the economy is going – not where it’s been. Thereby giving us the ability to take action early. Not when it’s too late.
Taking action: Keep up with this weekly BLOG update. If the SHI index moves appreciably – either showing massive improvement or significant declines – indicating expanding economic strength or a potential recession, we’ll discuss possible actions at that time.
The BLOG: A few weeks ago, I shared my concern that the upcoming French elections are concerning. With the election now less than 30-days away, I expect the financial markets to begin paying closer attention. And react.
Why? Well, take a look at this image, courtesy of the London Financial Times:
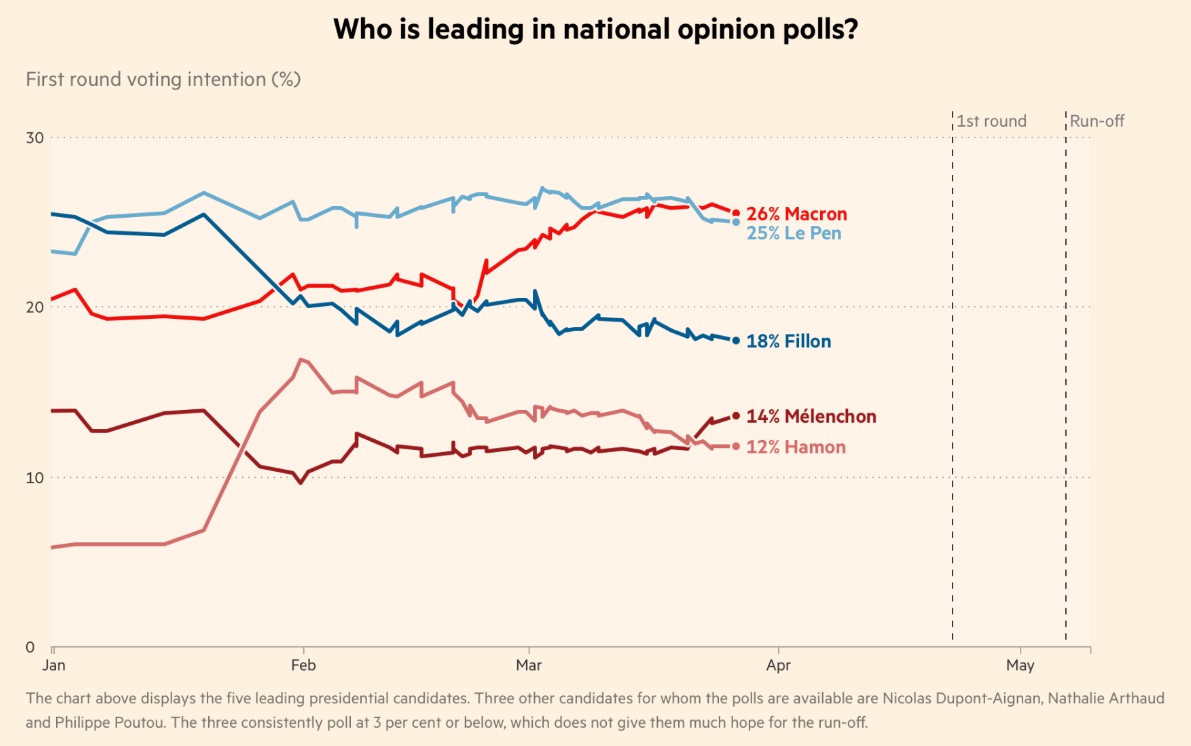
Yes, these are opinion poll results. And you know how much I dislike opinion polls. Notwithstanding, Le Pen appears to be a legitimate contender here. Which is extremely worrisome, because if elected she has:
-
Pledged to cut taxes for households;
-
Guaranteed to increase welfare benefits for the working class;
-
Promised to exit the euro and return to the French franc.
-
Promised she will instruct France’s central bank to print more money for the purpose of reducing the country’s debt.
The last point above is completely non-nonsensical. Print more money to reduce debt? That’s a new one. Because cash in circulation is a liability for a central bank. Crazy talk.
She claims she’ll pay for the first two by (1) reducing immigration and (2) withdrawing from the EU.
The first may be possible but the second? More crazy talk.
Talk of exiting the euro is what worries me the most. And it will worry the markets as the election approaches – if she remains close in the polls. But to win, a candidate needs 50% of the vote in the first round. This appears unlikely. So it looks like the May 7th ‘run-off’ is the real test:

Again the polls suggest my concerns are for naught. I hope so.
Because a Le Pen win could destabilize the euro…and set in motion a crushing cascade of global GDP repercussions. Which is why I’m concerned the United States financial markets will begin to stress over this event by mid-April. The stock market could slip 1,000 points or more … and interest rates on US securities will decline as global investors “seek safety” in US Treasury debt. If you agree, too, you might put a bit of “dry power” on the side lines and watch. I am.
But for now, let’s have a steak with our potatoes. How is the SHI shaping up this week? Let’s take a look. But lets start with the long-term trend graph:

As you can see, this week’s SHI reading is a negative (-20)
By itself, this reading could be interpreted as quite weak. (You’ll recall the lowest possible SHI reading is a negative -44.) And, perhaps it is. But in historical context, while this reading is weaker than the SHI readings for 3/30/2016 and the entire month of April (in 2016), it appears to be somewhat consistent for this time of the year.
As we now have year-over-year (YOY) data, I’m going to change the two-week comparison a bit. From here on, the 2-week comparison will show THIS week’s SHI data and the approximate same week from one year ago. Take a look:

I’m a bit concerned that, with the exception of one time slot at Ruths’ Chris, only Mastro’s has booked tables. Tables at our other three pricey steakhouses are wide open. While the 3/30 reading from last year was also week, as you can see 3 of the 4 restaurants had booked tables.
Unfortunately, we don’t the the benefit of SHI readings from January thru the beginning of March, 2016, to consider. Because while the very recent SHI readings are weak, in general, the Q1, 2017 SHI readings have been strong – when averaged over the quarter. In fact, they average higher than any prior quarter. Here are the “average” SHI readings for each calendar quarter we’ve tracked:
-
Q1, 2016: (-1.60)
-
Q2, 2016: (-0.17)
-
Q3, 2016: (-0.91)
-
Q4, 2016: 8.15
-
Q1, 2017: 10.85
It’s important to note we had only 5 SHI readings from Q1, 2016 (so the number above is the sum of the 5 readings divided by 5), so we can’t make any meaningful comparisons between last year and this year. But we can easily say Q1, 2017 is far stronger than the average SHI reading from any prior quarter.
You’ll recall Q1 2016 GDP grew at the paltry annual rate of 0.8%. The weakest quarterly GDP reading in 2016. Corresponding to a very weak Q1 SHI reading.
Could the strong SHI average in Q1, 2017 suggest GDP growth will be much stronger in this quarter?
Quite possibly. 🙂


