SHI Update 3/29/2017: French Fried?
March 29, 2017SHI Update 4/12/17: Chickens and Eggs
April 12, 2017
At its essence, the SHI was created as a barometer of US consumer spending. And using the resulting data, we attempt to predict the direction of the US economy. Our theory is simple: As about 70% of US economic growth is driven by the money we spend on goods and experiences, the BEAs metric called “Personal Consumer Expendatures” or PCE should be a good economic indicator. If spending increases, our GDP should be increasing. And vice versa.
Which is why the February 2017 highlights from the BEA are meaningful: The 0.1% increase in PCE was the smallest change since March of 2016, when the PCE was flat. February’s paltry increase came on the heals of a weak January reading – only a 0.2% increase. Could these readings indicate a deceleration in spending, and by extension, GDP growth?
Welcome to this week’s Steak House Index update.
As always, if you need a refresher on the SHI, or its objective and methodology, I suggest you open and read the original BLOG: https://terryliebman.wordpress.com/2016/03/02/move-over-big-mac-index-here-comes-the-steak-house-index/)
Why You Should Care: The US economy and US dollar are the bedrock of global economics. This has been true for decades…and notwithstanding plenty of predictions to the contrary, it will continue to play this role for years to come. Fear not.
Nominal global GDP is about $76 trillion. US GDP is almost $19 trillion. Is it growing or shrinking? If it’s growing … how rapidly? How might this information impact our daily financial and business decisions?
The objective of the SHI is simple: To predict the GDP direction ahead of official economic releases. While the objective is simple, the task is not. BEA publishes GDP figures the instant they’re available. Unfortunately, the data is old, old news; it’s a lagging indicator.
‘Personal consumption expenditures,’ or PCE, is the single largest component of the GDP. In fact, the majority of all US GDP increases (or declines) usually result from (increases or decreases in) consumer spending. Thus, this is clearly an important metric to track.
I intend the SHI is to be predictive, anticipating where the economy is going – not where it’s been. Thereby giving us the ability to take action early. Not when it’s too late.
Taking action: Keep up with this weekly BLOG update. If the SHI index moves appreciably – either showing massive improvement or significant declines – indicating expanding economic strength or a potential recession, we’ll discuss possible actions at that time.
The BLOG: Consumer spending drives the US economy. It appears to be slowing – slightly. Not by a lot … imagine a pin-prick hole in a balloon, and the slow air leak that would result. Compare January and February, 2017, to the last 6 months of 2016. During that period, consumer spending grew meaningfully, showing increases of:
-
July: 0.4%
-
Aug: 0.1%
-
Sept: 0.7%
-
Oct: 0.5%
-
Nov: 0.3%
-
Dec: 0.6%
With the exception of August, the 2017 growth rates – by comparison – are paltry.
Adding fuel to the fire, total US Vehicle Sales in the United States decreased to 16.62 Million in March from 17.58 Million in February of 2017 – an almost 5.5% decline. (Total Vehicle Sales in the United States averaged 15.47 Million from 1993 until 2017, reaching an all time high of 21.77 Million in October of 2001 and a record low of 9.05 Million in February of 2009.)
Is this a concern? Sure. Like the SHI itself, its indicative of potential weakness in our economy. We’ll have to watch and see if a trend develops.
In the interim, talking about fire, let’s see how is the SHI shaping up this week. Let’s take a look. Here is our the long-term trend chart:
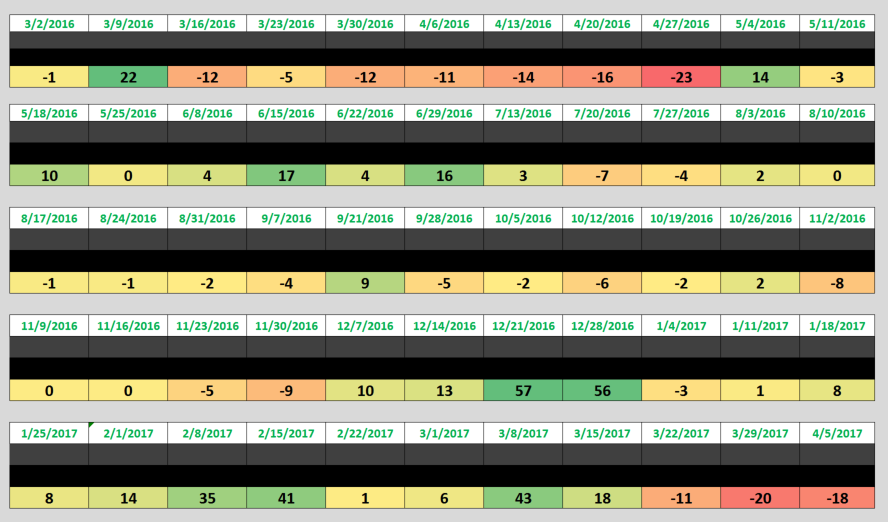
As you can see, this week’s SHI reading is a negative (-18) – once again, very much in line with the SHI reading from one year ago – a negative (-11).
Once again, the SHI reading is weak. As it was last year at this time. Could the culprit be April 15th? Tax day? Hmmm…..
Here is the 2-week comparison of this week’s SHI data and the approximate same week from one year ago. Take a look:

Last week, I posed this question:
Could the strong SHI average in Q1, 2017 suggest GDP growth will be much stronger in this quarter?
Possibly. It will be interesting to see the Q1 GDP number when it’s released on April 28th. But as strong as that number might be, Q2 seems to be on a slow simmer at best.
At present, I have no concern of a possible economic slowdown. On the other hand, I also have no concern over an economic breakout where GDP growth is so robust the FED must raise rates to slow it down. I know, not a very exciting update …. 🙂


1 Comment
From this post, I learned that I am personally very bad for the economy, as in my natural state, I strive to spend the absolute minimum on goods and experiences. A good person who is bad for the economy, it just doesn’t seem right. On another note, I am beginning to see the value in the SHI. Before I thought it was a bunch of hooey. But now I can believe it would accurately show when peeps are tightening their belts. I mean, a dinner at Maestro’s is most inappropriate when you’re feeling iffy about money.