
SHI Update 7/12/17: The Silent Giant
SHI Update 7/5/17: A Shrinking World
July 5, 2017
SHI Update 7/19/17: Lend Me Money!
July 19, 2017
The BIS is the biggest, most powerful bank in the world … and you’ve probably never heard of it.
The Bank for International Settlements (BIS) was formed in 1930. They’ve been active for 87 years … and yet, you’ve probably never heard of them. The BIS is owned by 60 member central banks, including the US Federal Reserve.
Collectively, the central banks that own the BIS span the globe and make up about 95% of world GDP. So when the BIS talks, we need to listen.
Because they’re speaking for their members, collectively. Here’s a list of their member central banks: http://www.bis.org/about/member_cb.htm
The BIS is headquartered in Basel, Switzerland. Their mission:
- To serve central banks in their pursuit of monetary and financial stability,
- To foster international cooperation in those areas, and,
- To act as a bank for central banks.
So, in a nutshell, the BIS is the central bank for Central banks. And, as such, they have the power to move markets. Which is precisely what they did on June 26th.
Welcome to this week’s Steak House Index update.
As always, if you need a refresher on the SHI, or its objective and methodology, I suggest you open and read the original BLOG: https://terryliebman.wordpress.com/2016/03/02/move-over-big-mac-index-here-comes-the-steak-house-index/)
Why You Should Care: The US economy and US dollar are the bedrock of the world’s economy. Is it expanding or contracting?
The world’s GDP is about $76 trillion. Our US GDP is almost $19 trillion — about 25% of the total. No other country is even close.
The objective of the SHI is simple: To help us predict US GDP movement ahead of official economic releases — important since BEA data is outdated the day they release it.
‘Personal consumption expenditures,’ or PCE, is the single largest component of US GDP. In fact, the majority of all US GDP increases (or declines) usually result from (increases or decreases in) consumer spending. Thus, this is clearly an important metric to track. The Steak House Index focuses right here … right on the “consumer spending” metric.
I intend the SHI is to be predictive, anticipating where the economy is going – not where it’s been. Thereby giving us the ability to take action early. Not when it’s too late.
Taking action: Keep up with this weekly BLOG update.
If the SHI index moves appreciably -– either showing massive improvement or significant declines –- indicating expanding economic strength or a potential recession, we’ll discuss possible actions at that time.
The BLOG:
An odd thing happened on June 26th. Take a look:
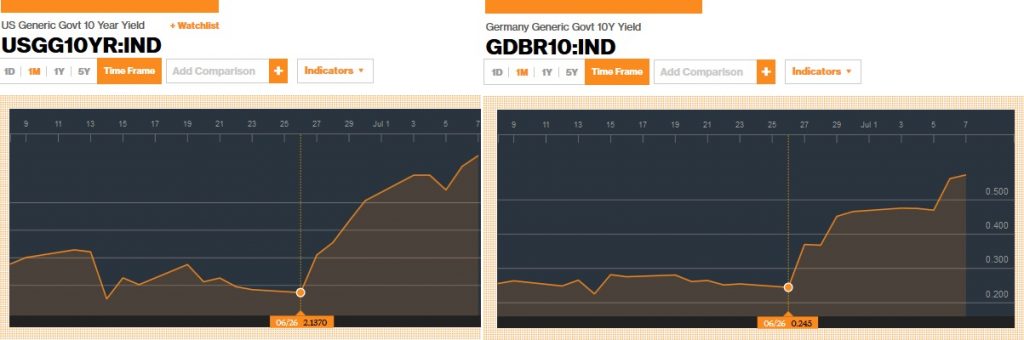
These two charts, courtesy of Bloomberg, show a one-month history of the 10-year Treasury bond (left) and the 10-year German Bund (right.) I’ve placed them side-by-side to make the movement easier to see. Enlarge the image and take a look.
On June 26th, rates on both the T-bond and the Bund began to rise. Significantly. The exact same day … and almost the same pattern. The day after, on the 27th, Japan followed suit:
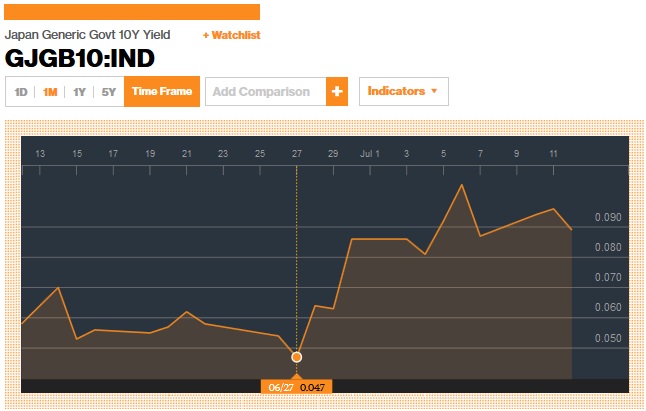
Once again, notice the pattern. And almost in tandem…with the US and German bonds. Odd right? What triggered this upward movement and pattern? The BIS did.
In their 87th annual report, published the day before — on June 25th — they discussed the need for “normalization” of central bank monetary policy. When the central bank for central banks speak, traders listen. The BIS owners and members include countries with 95% of global GDP — so we better listen too.
What, precisely, did the BIS say? What was so compelling that trillion dollar markets moved so rapidly? In a nutshell, they reminded the global bond market that central banks have very large balance sheets … and when they collectively decide it’s time to shrink those balance sheets, bond values will fall and interest rates will rise. This comment spooked the bond markets. All of them.
Let’s take a closer look. Take a look at the chart below, showing the assets owned by a number of central banks:

“AE” is short for Advanced Economy. The US, countries in the EU, etc. The “major” AEs in the chart above include the “Euro area”, Japan and the US. (China, with about $5 trillion in assets, must be in the brown section.) Collectively, the major AEs have over $13 trillion in total assets. Hmmmm…that number is up significantly from the beginning of 2016. Frankly, I found the number surprising. And while I have no doubt the BIS figure is accurate, I decided to check the data from another source. Fortunately, on July 7th, Dr. Edward Yardeni just updated his central bank asset figures. Here’s a link to his site … http://www.yardeni.com/pub/peacockfedecbassets.pdf … and here is a great, detailed graphic:
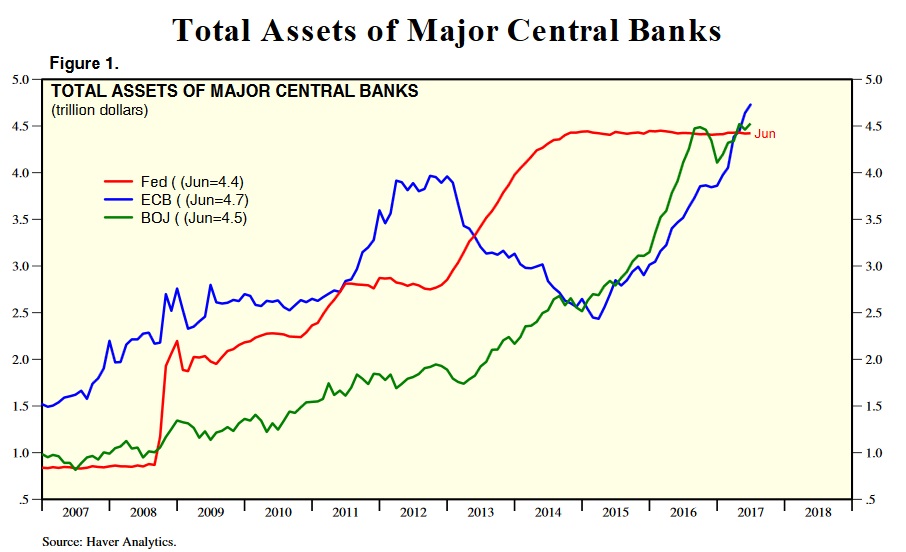
Sure enough, the big asset increase took place in the EU. In less than 2 years, the European Central Bank has added more than $2 trillion to their balance sheet.
Today, the total assets held by the “big 3” are almost $13.7 trillion. This is a big number. Big enough to move the market. If pushed to make a change. And the BIS report pushed a bit. In a section they titled “The Great Unwinding,” they commented,
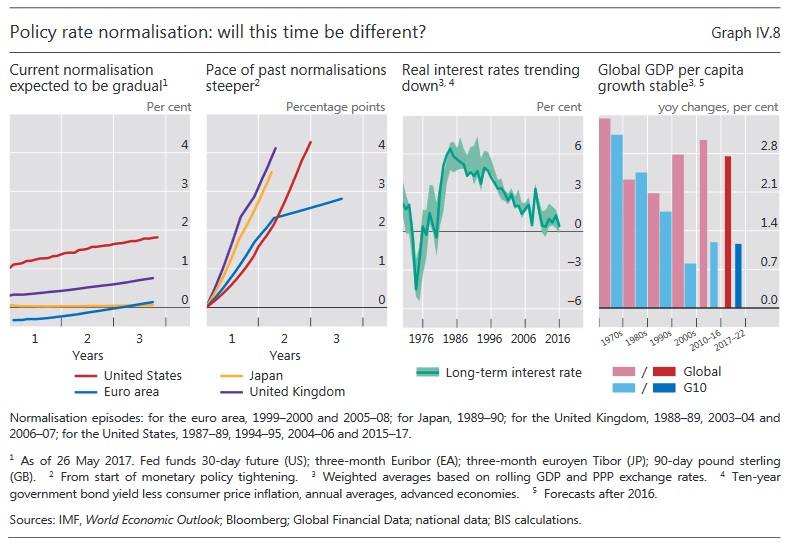
“Policy normalisation has never been a question of “if” but rather of “when, how fast and to what level”. These questions gained prominence in the past year, as the case for prolonged accommodation weakened and several central banks turned their attention to the process of normalisation.
Currently, markets expect rates to rise very gradually (Graph IV.8, left-hand panel), as bloated central bank balance sheets are trimmed.
Yet such expectations contrast sharply with past episodes of rising rates, which were typically much less gradual (Graph IV.8, second panel).”
“Bloated central bank balance sheets,” eh? That comment seems downright disrespectful! 🙂
Let me simplify this message a bit. The BIS is suggesting that while the financial markets are expecting a slow, gradual balance sheet management change at the FED, Bank of Japan, the ECB, and other central banks, in past cycles the central banks have acted fairly quickly to raise short-term interest rates. Take a look:
“Caution is normally interpreted to mean gradualism and transparency. Gradualism allows central banks to test the waters, seeking to avoid abrupt market adjustments and policy reversals. Transparency about the future policy path aims to remove one important source of uncertainty. Transparency may also go hand in hand with the gradual release of information about that path, in order to avoid sudden asset price adjustments, given the markets’ tendency to telescope the future into today’s prices. But gradualism and transparency are no panacea. Gradualism naturally increases the risk of falling behind the curve, be it in terms of the build-up of inflationary pressures or of debt globally. And transparency about the path of central bank measures may unintentionally encourage greater risk-taking in markets.”
More seeds of doubt. Again, from the behemoth that is the BIS. And so the bond markets moved. In fear.
Thursday of last week, on July 7th, the FED followed up with their “Monetary Policy Report” which, not surprisingly, contained very similar commentary, only more specifically US policy. (If you’re interested, here’s a link to the report. It’s worth a look: https://www.federalreserve.gov/monetarypolicy/files/20170707_mprfullreport.pdf)
On the topic of shrinking the FEDs balance sheet, here’s what they had to say:
“Balance sheet policy. In June, the FOMC issued an Addendum to the Policy Normalization Principles and Plans that provides additional details regarding the approach the FOMC intends to follow to reduce the Federal Reserve’s holdings of Treasury and agency securities in a gradual and predictable manner. The Committee currently expects to begin implementing the balance sheet normalization program this year provided that the economy evolves broadly as anticipated.”
So, BIS commentary aside, the FEDs plan appears unchanged. The FED stance is a “wait-and-see” position…slow and steady.
Before we cut into this week’s juicy Prime Rib, permit me a few more words on labor, a topic from two weeks ago. In that blog, I dispelled the myth of the Phillips Curve. A correlation between the unemployment rate and inflation definitely exists – just not to the extend predicted by the Phillips Curve.
The BIS Annual Report supports my previous conclusion. Their comment:
“Subdued wage growth is a sign of labour’s declining “pricing” power. While a number of factors have contributed to this development, two deserve special attention. One factor has been the dramatic expansion of the global labor force. A second factor has been industrial automation.”
Precisely. The report included the image below, showing the significant and profound decline in labor’s income share in developed economies. Said another way, developed economies — like the US — have a diminished need for labor. Thus, labor has diminished pricing power. And wage increases, as a result, are muted.

If the demand for labor is on the decline, in the macro, then labor doesn’t have pricing power — the ability to demand higher wages. This condition is likely the cause of the continuing general drag on wage growth.
Time to check in on our steakhouses. Here’s a fun factoid: Ruth’s Chris Steak House in Irvine, CA serves the finest USDA Prime beef available, broiled at 1,800° and served on 500° plates, so your steak stays hot, juicy and delicious from first bite to last.
Wow. That’s some serious heat. Let’s see if reservation demand is that hot.
No, unfortunately, it is not. A year ago, reservation demand was fairly strong. Mastros, of course, was almost fully booked. But all three of our pricey eateries had booked time slots. Not this year. Today the SHI is a negative <-17> — a very weak reading. Last year, the SHI was a positive 3. Take a look:

Even worse, this week’s SHI continues the trend we’ve seen since late in May. As we can see below, this trend is well entrenched. Our SHI “spread” for this week is 20 points. That’s quite sizable. And fairly consistent as we compare weekly SHI readings from 2016 and 2017:

Clearly, if the SHI is an accurate barometer for consumer spending, we’re seeing a meaningful decline. And, as we know, as growth in the US GDP is heavily reliant on consumer spending, a slowdown here is likely to cause a slowdown in GDP growth. I believe the SHI is forecasting a consumer spending slowdown in Q3, 2017. Which will likely result in a weak Q3 GDP reading. Not negative, but weak.
Permit me to finish this week’s BLOG with a few final observations on long-term interest rates, inflation, consumer spending and the GDP. The BIS comments above notwithstanding, I remain steadfast in my belief long-term rates will not increase meaningfully from here. They will vacillate as conditions and rhetoric ebb and flow. But absent a large spike in inflation — again, something I feel is extremely unlikely — long-term rates will remain at current levels. In prior blogs, I’ve discussed at length the idea we’re seeing a new, much lower “neutral” interest rate, here in the US and across the financial systems of all developed nations. My belief is supported by my prior observations and BLOGS on demographics and excess capital trends. I have no doubt the BIS, the FED and many of the other central banks around the world wish long-term rates were higher. Higher long-term rates solve a lot of monetary problems.
But, at the end of the day, the BIS, the FED, and other major central banks will find their words will move markets in the short term, but over the longer term, strong words generate the same result as pushing on rope. Not much at all.
- Terry Liebman


3 Comments
Fascinating read about central banks. Is there a scenario in our future where the US creates inflation to use it as a tool to pay down its debt?
Thanks John. Much appreciated.
Here’s my thought/opinion. I think many of us tend to ascribe our own tendencies or beliefs to unfeeling, bureaucratic institutions. Frankly, I don’t believe they every give the idea any thought. They have a ‘playbook’ and they stick to it.
Might you or I take this approach to reduce the sting of our massive public debt? Sure! But I don’t think the FED — or anyone at the FED — considers the merits of such an idea. The FED has set a mandate of 2% annual inflation. Many other central banks have adopted this same mandate and metric. Paraphrasing ‘Goldlocks and the 3 Bears,’ apparently 2% annual inflation is ‘just right.’ Might the FED, and other central banks, later decide this target is too low? Possibly. I actually think a target of 2.5% makes more sense — especially after years of undershooting the goal. But the FED remains concerned about possibly overshooting, triggering a difficult-to-control inflationary spiral. Like the proverbial Genie, once out of the bottle, he’s hard to get back in.
So, the short answer is ‘no.’ 🙂
Terry
Thank you ever so for you blog.Thanks Again. Really Cool.