
SHI10 6.9.21 – Quite a JOLT!

SHI 6.2.21 – Where’s the Beef?
June 2, 2021
SHI 6.16.21 – The Big Apple is Back!
June 16, 2021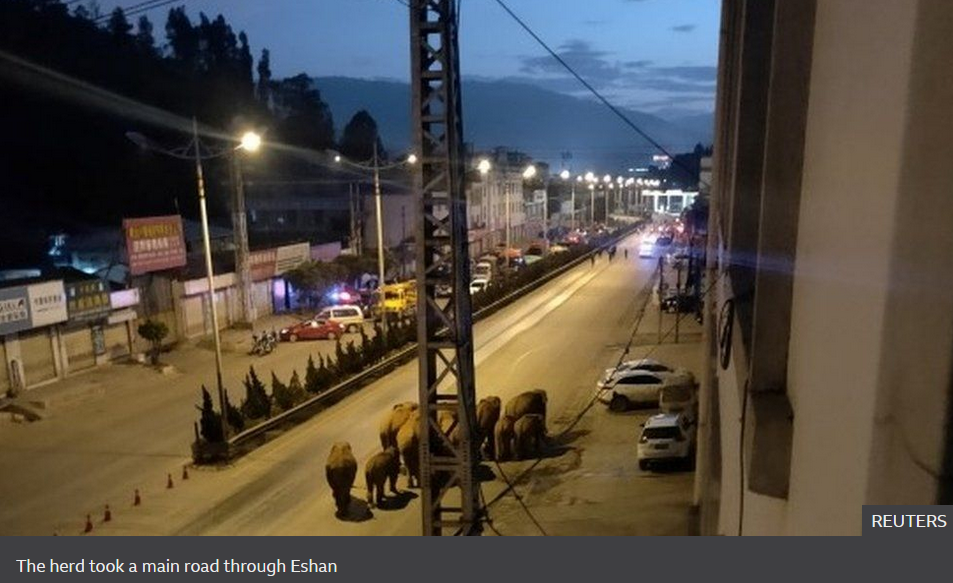
Last week, we asked “Where’s the beef?”
That question remains open … because shortages remain. But we know where the elephants are! Walking the roads of Eshan, China … without jungle or zoo in sight. Perhaps they seek the best Egg Foo Young?
“
Elephants in your living room would be a JOLT.“
“Elephants in your living room would be a JOLT.“
But that’s not the jolt we’re discussing today. Have no fears, I’ll get back to those cute elephants a bit later.
Welcome to this week’s Steak House Index update.
If you are new to my blog, or you need a refresher on the SHI10, or its objective and methodology, I suggest you open and read the original BLOG: https://www.steakhouseindex.com/move-over-big-mac-index-here-comes-the-steak-house-index/
Why You Should Care: The US economy and US dollar are the bedrock of the world’s economy.
But is the US economy expanding or contracting?
The short answer? Expanding. A lot. Forever more, COVID-19 will be mentioned concurrently with any discussion about 2020 GDP. Collectively, the world’s annual GDP was about $85 trillion by the end of 2020. But I am confident all 2021 GDP discussions will start with a nod to the blowout 1st quarter GDP growth number, because our ‘current dollar’ GDP grew at the annual rate of 10.7%! Annualized, America’s GDP blew past $22 trillion during the quarter, settling in at $22.0489 trillion. The US, the euro zone, and China continue to generate about 70% of the global economic output.
The objective of this blog is singular.
It attempts to predict the direction of our GDP ahead of official economic releases. Historically, ‘personal consumption expenditures,’ or PCE, has been the largest component of US GDP growth — typically about 2/3 of all GDP growth. In fact, the majority of all GDP increases (or declines) usually results from (increases or decreases in) consumer spending. Consumer spending is clearly a critical financial metric. In all likelihood, the most important financial metric. The Steak House Index focuses right here … on the “consumer spending” metric. I intend the SHI10 is to be predictive, anticipating where the economy is going – not where it’s been.
Taking action: Keep up with this weekly BLOG update. Not only will we cover the SHI and SHI10, but we’ll explore related items of economic importance.
If the SHI10 index moves appreciably -– either showing massive improvement or significant declines –- indicating growing economic strength or a potential recession, we’ll discuss possible actions at that time.
The Blog:
Payroll employment (non-farm) increased by 559,000 in May 2021 – far below expectations for the monthly metric. Yes, the “market” was forecasting an employment increase in May of over 800,000. Given the facts that the US economy is roaring back by most measures, and when May began payroll employment was still down by 7.6 million people from its pre-pandemic level in February 2020, this outcome was unexpected. Why, you may be asking, with about 7.6 million folks off the employment rolls, was job formation somewhat weak? Is the problem an inadequate number of job openings? Are those 7.6 million people having trouble finding an employer willing to hire? The answer may shock you.
No. Quite the opposite – employers are desperate to find employees! Job openings — jobs seeking workers — in the United States have never been higher. The JOLT report – ‘Job Openings and Labor Turnover’ – posted June 8, 2021, by the US Bureau of Labor Statistics reached a new high-water mark. As of the last business day of April, job openings reached 9.3 million. Said another way, for the first time in history, US employers were looking to hire 9.3 million people as of the end of April.
Confused? You should be. At first blush, we have to wonder why each of the 7.6 million people without a job don’t simply take one of the 9.3 million that are available. That seems simple enough, right?
But before we answer that question, let’s take a step back and put these issues in perspective. Take a look at this graph:
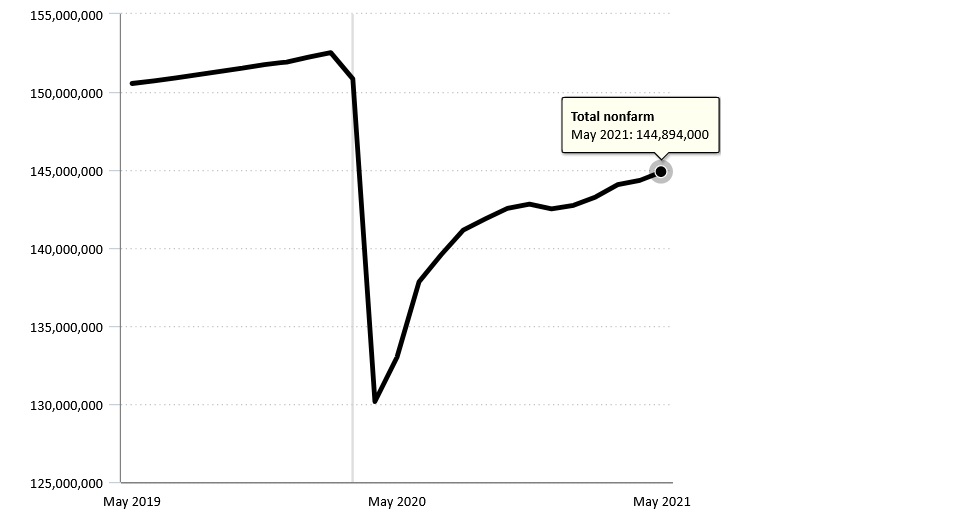
Here we see the huge job loss in April of 2020, the direct result of the Covid-inspired business shutdowns. The “V” you see above reflects the fastest employment loss since employment records have been kept. And the most jobs lost in one month. Ever. April of 2020 broke every prior employment record … and not in a good way.
In fact, during April of 2020, non-farm payrolls had shrunk to just slightly over 130 million – more than 20 million jobs were lost in one month. Staggering. For perspective, recall that total non-farm payroll was around 150 million. Thus a loss of “20” out of “150” — in a single month — is staggering.
And then we see the hiring activity roaring back with over 144 million employed about 1 year later. But even with the recovery to date, 7.6 million hard-working folks fewer have jobs today than pre-pandemic.
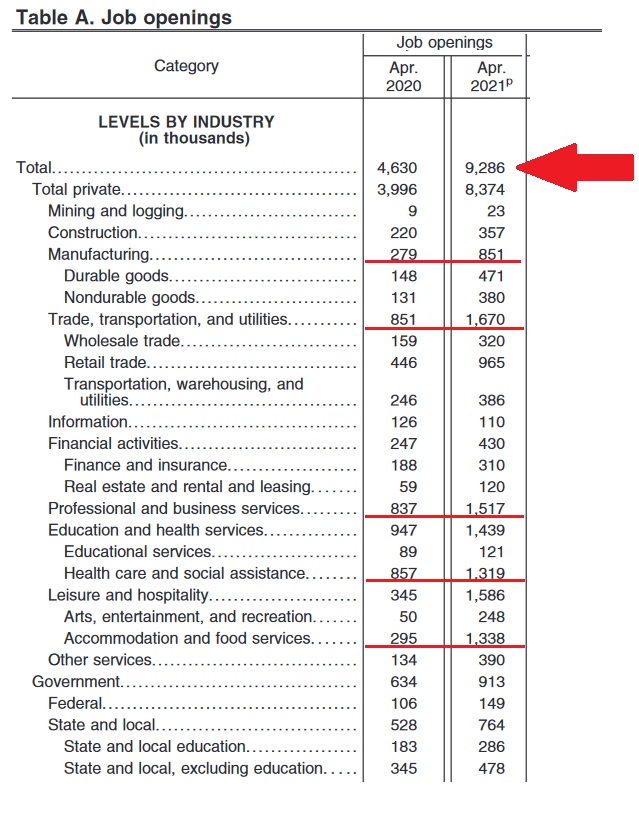
Now, take a look at the chart to the right, courtesy of the US Bureau of Labor Statics.
This is the JOLT report. JOLT is an acronym for ‘Job Openings, Labor Turnover.’ Every month, this report tracks the number of jobs that seek workers, labor turnover, etc. Next to the red arrow, we see the post-pandemic, April of 2020 “low” for job openings … and today’s new all-time record. One year ago, US employers were seeking a little over 4.6 million workers; today, that number has exploded to almost 9.3 million.
I’ve added a few red lines to highlight a some numbers that jumped out at me.
Manufacturing needs over 850,000 people right now. “Trade” needs close to 1.7 million … and “Professional and business services” isn’t too far behind. Healthcare, too, is in dire need of employees.
And look at the deficit of labor in the “Accommodation and food services” group. Hotels and restaurants alike are struggling to find workers right now. Remember this the next time you go out for a highfalutin meal at your local pricey steak house. They are probably operating with a short staff.
Which brings us back full circle to the question above. Last week, the FED ‘Beige Book’ highlighted the fact that supply chain disruptions and shortages were commonplace across the country. Notwithstanding the fact that the US has 7.6 million fewer workers today than pre-pandemic, today many business face labor shortages. Labor demand is far outstripping supply. In fact, labor demand has never been this high.
The current rapid economic expansion is most certainly contributing to the huge growth in employer demand for new workers. Typically, during relatively “stable” economic conditions, the “job opens rate” tends to hover close to 4.6% of the labor force. Today, that number rests at 6%.
The “Help Wanted” signs are out in force.
Here is the JOLT summary from the BLS:
“On the last business day of April, the job openings level and rate increased to series highs of 9.3 million (+998,000) and 6.0%, respectively. (The job openings series began in December 2000.) Job openings increased in a number of industries with the largest increases in accommodation and food-services (+349,000), other services (+115,000), and durable goods manufacturing (+78,000). The number of job openings increased in all four regions.”
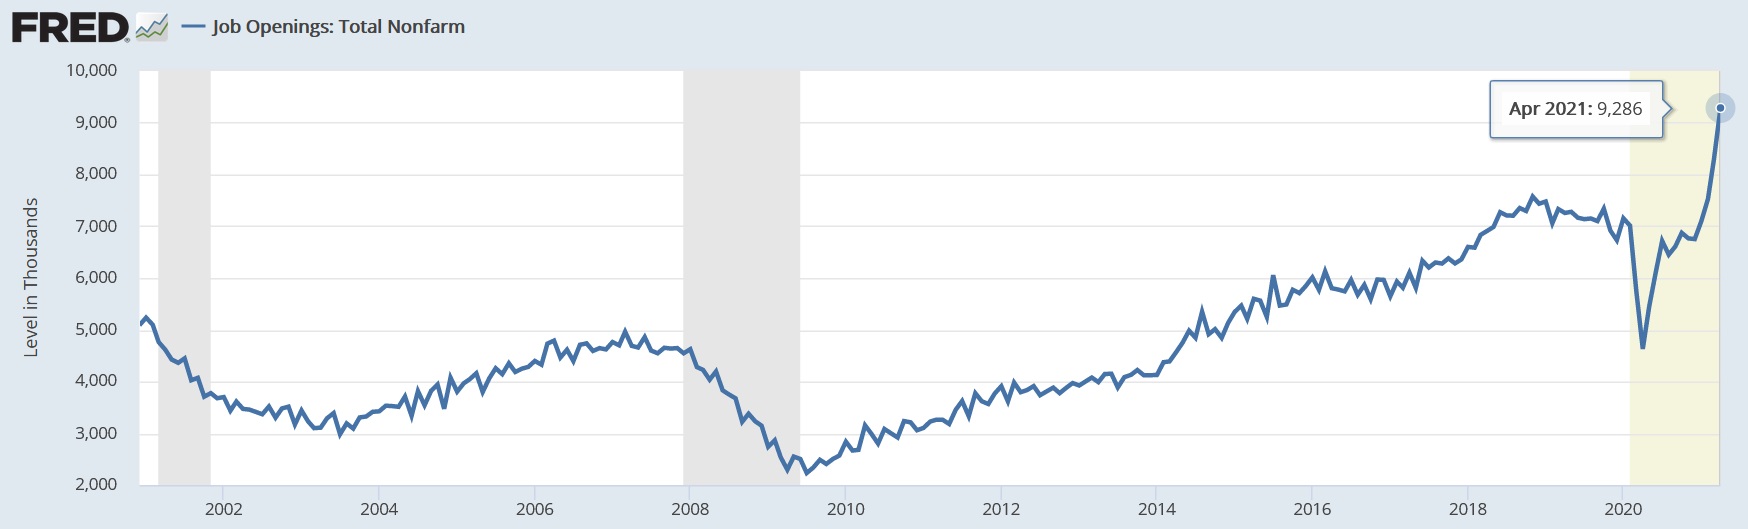
As the BLS said above, this data was first tracked at the end of 2020. Here’s a 20-year chart, courtesy of the St Louis FED, which shows the entire JOLT history:
Logic would suggest that with 9.3 million open jobs at a time when 7.6 million people who previously had a job no longer do, a solution would be simple: Match the unemployed with the open jobs. Simple.
But much like the supply chain disruption in “goods”, we have the same problem in “services,” or labor. Geography, training, job-skills, job type, child care needs, and public policy, among other things, have created the same disruption and dislocation in the labor market. It’s a real problem! With focus and effort, over time the problem fix itself and equilibrium will return. But until that time, expect these disruptions to create cost and availability challenges in ALL areas of our economy.
Including, of course, our steak houses. What a perfect segue into reservation demand at the SHI10 this week. Here we go …
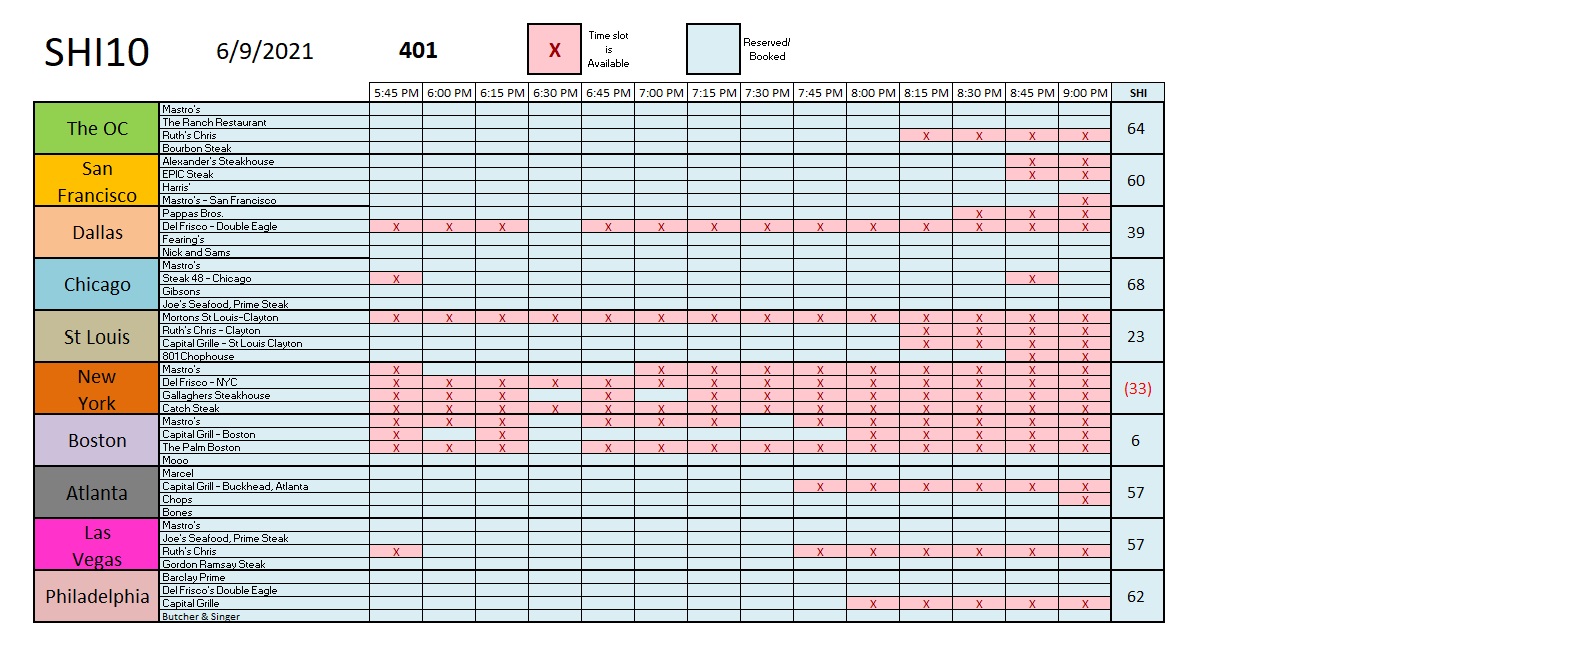
It’s another strong reservation demand week at most of our expensive steak houses. Reservation demand appears weak only in the east coast markets — specifically NYC and Boston. But in every other city tracked in the SHI10, reservations at our expensive eateries are in high demand. Here’s the longer term trend report.
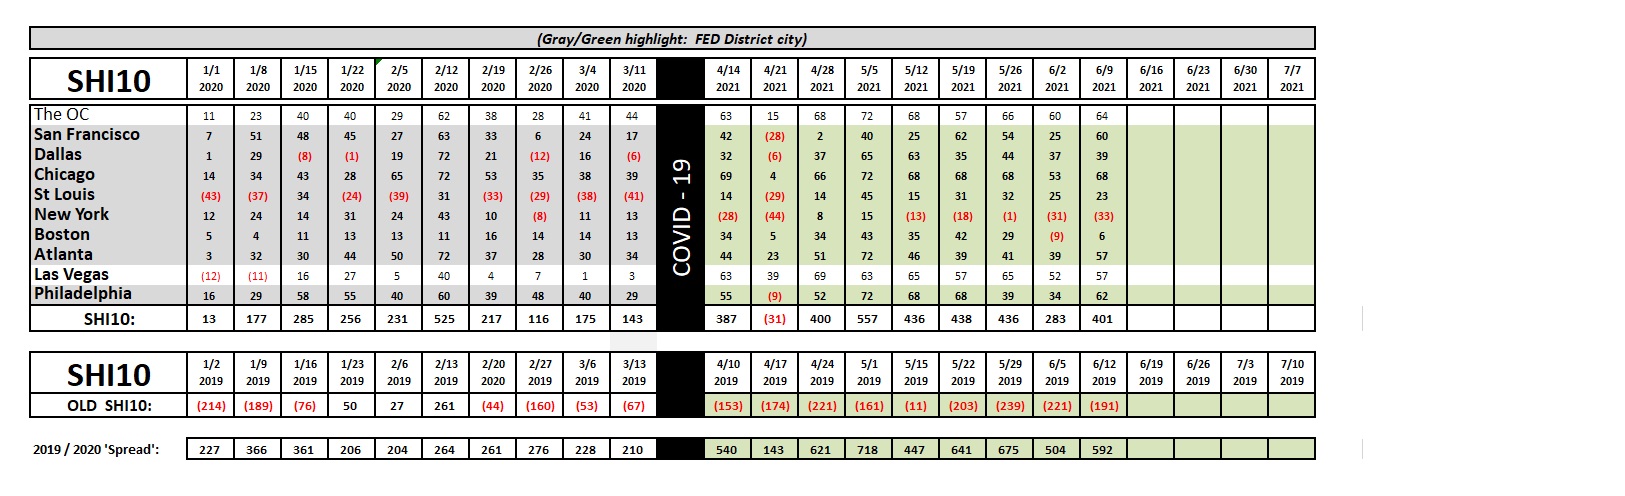
The 2019/2021 ‘spread’ remains quite strong. The chart confidently forecasts continued strong economic activity. Remember those elephants? I think they are looking for an open table — vegan, of course — I suspect full restaurants has forced them to travel far from home. The economy in China is booming too. 🙂
In summary: “Food services” and hotels are currently seeking 1,338,000 new hires. Last month, according to the BLS, employment in “food services and drinking places” increased by a paltry 10,000 people. Employment increased a bit more in the “accommodations” category: This group increased employee count by 35.5 thousand. Clearly, the food and hotel industries have a problem. A serious problem.
Which means we Steak House Index groupies do as well. The price of that steak you love is about to go up. A lot. Not only are beef prices heading higher, but restaurant labor costs are sure to follow right behind. Prices are heading north. Is this inflation?
The FED says no. This is not inflation. They tell us that in the short-term, their favorite metric – the PCE – may reflect price increases resulting from all the disruptions and dislocations, but they assure us all price movement is, to quote Powell, “transitory.” Is he right?
We don’t know yet. But I think Powell is correct. Demand is sure to remain high … and as supply chains heal, supply will grow in size to meet that demand. In the interim, we are likely to see a serious, and painful, bump in prices and costs as America reopens, but in 6- to 9-months or so, supply chain problems are likely to be fixed and prices are likely to stabilize.
Before that time, our expensive eateries are open for business.
But they will be short waitresses, busboys, kitchen staff, sommeliers, and the list goes on and on. So if you’re lucky enough to snag that rare and perfect reservation slot at Mastros, bring your own wine and ‘wine key.’ Then open your own wine. (Be stealthy … they frown on this.) And pour yourself a glass. Sit back. Take a sip. Relax. Take a deep breath. Now, take another sip. Or two. It may be a while before you see your waiter. But who cares? Both you and your wine are relaxed and ‘breathing.’ Your wine is wonderful … the company at your table, scintillating, and the night is young. Life is good!
<|> Terry Liebman


