
The Physics of Economics – Part 1
Get it While it’s HOT!
May 11, 2016The May 18 Steak House Index Update
May 18, 2016Sir Issac Newton is known as one of the most influential scientists of all time. In the second half of the 17th century (and into the 18th), Newton was one of a number of ‘Natural Philosophers’ who sought to explain natural phenomenon using math and physics (among other things.) His 3 ‘laws of motion’ have become the foundation upon which centuries of classical mechanics (physics) are based…
Why you should care: Not only do Newton’s 3 laws explain – and predict – behaviors of the physical bodies all around us, I believe they also can be applied to, and explain, financial market behaviors. They can help explain how current expectations modify human behavior. And they can help us understand (and predict) both the persistence of large market trends and the concept of ‘unintended consequences.’
Thus, knowing the 3 laws, and how to apply them, might us predict future market behaviors and directions.
Taking action: Test these theories. See if they help you gain insight. Perhaps they will help you forecast future economic outcomes that may impact you personally.
THE BLOG: Let’s distill Newton’s 3 laws to their essence:
- Law 1: “An object traveling at a constant speed, in a constant direction, will continue to do so unless acted upon by another force.”
- Law 2: “Force = Mass times Acceleration” (F=M*A)
- Law 3: “For every action there is an equal, yet opposite, reaction.”
These are fairly straightforward. Perhaps #2 is a bit more opaque. Let’s simplify it a bit: Said another way, #2 simply means that the bigger an object is, the more force it takes to move it.
Law 1: Law 1 is another way to consider, and predict, market behaviors and expectations.
You’ve probably noticed how surprised people (and markets) are when things change suddenly. We all tend to expect consistency – that which happened yesterday will probably continue unchanged today and tomorrow. When stock markets are rising, we tend to expect them to continue rising. The same when the opposite occurs.
Right now, inflation expectations are at all time lows. The FED of Cleveland (with a lot of help from the University of Michigan) closely monitors public inflation expectations. On April 14th, they posted this information:
“The Federal Reserve Bank of Cleveland reports that its latest estimate of 10-year expected inflation is 1.71 percent. In other words, the public currently expects the inflation rate to be less than 2 percent on average over the next decade.“
Note this is the future 10-year expected inflation rate. The Cleveland FED has been tracking this metric since January 1 of 1982. (The entire historic data set is available on their site.)
Expectations have now been falling since 1982 – when the expectation was a high of almost 6.2%. (see the chart below). Today, its only about 1.7%. The lowest point: March 1, 2013, when the reading was 1.41%

Here’s the important take away: Household inflation expectations have fallen dramatically. And they have remained at these low levels. For years. The 10-year forecast has been below 2.00% since June of 2011, and now seems to be in a ‘trading-range’ of about 1.7%. Absent a SIGNIFICANT and meaningful “force” (using our Newtonian term) pushing expectations higher, they should remain here. Or very close to this level. Inertia applies here, too.
What might be “significant?” A large – and persistent – increase in one or more of the published inflation metrics, such as PCE or CPI. However, the large increase must be constant and repetitive over many months before we’d see a significant change in household inflation expectation.
Why is this important? For this reason: expectation drives behavior. And, thus, ultimately choices. If the general population believes very low inflation is here to stay, they will make decisions based on this belief.
The implication on our financial markets? Consider one of the most important metrics we’re watching today: The rate of wage growth.
If you’re old enough, you probably recall a thing called a ‘COLA.’ When inflation was high back in the 1980s (both actually and in expectation), employees often demanded a COLA – a ‘Cost of Living Adjustment’ – from their employers. This income adjustment, they believed, compensated for the erosion of purchasing power caused by inflation.
It was demanded because inflation was expected to continue at a very high rate. That was the belief at the time. It was a serious problem. Because the expectation of very high inflation became a self-fulfilling prophesy. Beliefs drove choices, choices drove behaviors.
But not today. Actual and expected inflation are both low. As a result, wage growth is more likely to remain at or near current levels. Again, inertia applies here, too.
Wage growth is one of the most important metrics to watch today. The FED is certainly watching. If wage growth were to accelerate significantly, it could be a trigger a series of FED funds rate increases later this year.
‘Average hourly earnings‘ is a metric tracked by the BLS and reported each month with the non-farm payroll numbers. Here’s the latest comment from the BLS:
"In April, average hourly earnings for all employees on private
nonfarm payrolls increased by 8 cents to $25.53, following an
increase of 6 cents in March. Over the year, average hourly
earnings have risen by 2.5 percent."
The FED of Atlanta takes this information and combines it with data from Census Bureau and their ‘current population survey’ to generate the ‘Hourly Wage Tracker’ below:
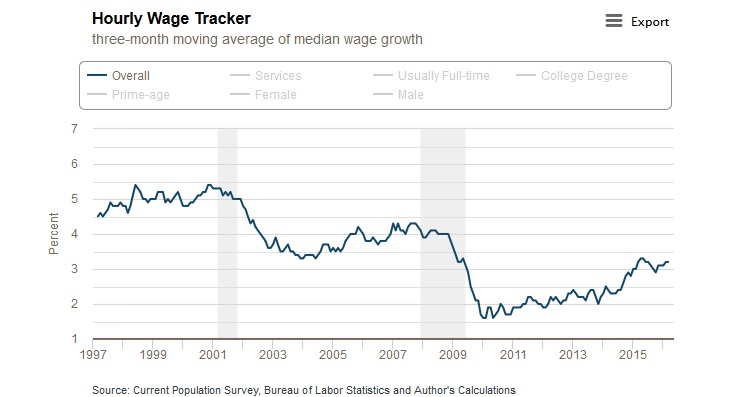
Wage growth is trending higher than, say, 5 years ago. This is to be expected. However, by historic standards, one would expect even higher growth rates at the ‘full employment‘ levels of today.
Economists believe, and history proves out this theory, there is a trade-off between unemployment and inflation. The question is this: What is the lowest unemployment rate consistent with stable inflation?
Known in economic circles as the “nonaccelerating inflation rate of unemployment,” or NAIRU, this is also a closely watched metric. Here is a related chart:

The theory: If US unemployment falls below the ‘natural rate’ of (current) unemployment – which is shown on the chart above – then wage inflation will begin, lifting the overall inflation rate. As you can see, the current estimate by our friends at the FED of St. Louis is 4.8%. With the current ‘official’ unemployment rate at 5.0%, we’re pretty close.
Thus, will the tail wag the dog … or the dog wag the tail? Will today’s super-low household inflation expectations keep wages lower, longer, or will wages begin to rise significantly once we breach the 4.8% unemployment rate?
Clearly, time will tell (assuming we get there…and the St. Louis FED is correct.) However, I contend Newton’s 1st law of motion will hold true: Wage inflation will remain muted longer than most expect.
In the next blog we’ll tackle Newton’s 2nd law! Come on back!
- Terry Liebman


5 Comments
Terry, so far, it all seems straight and constant!
[…] Trends tend to continue. Momentum carries them forward. I talked about this extensively in this BLOG post: https://terryliebman.wordpress.com/2016/05/14/the-physics-of-economics-part-1/ […]
[…] https://terryliebman.wordpress.com/2016/05/14/the-physics-of-economics-part-1/ […]
[…] https://terryliebman.wordpress.com/2016/05/14/the-physics-of-economics-part-1/ […]
[…] https://terryliebman.wordpress.com/2016/05/14/the-physics-of-economics-part-1/ […]