Happy Wednesday! As another week is in our rear-view mirror, let’s check the temperature of our steak. Is it well done? Welcome back to the steakhouse.
As always, if you need a refresher on the SHI, or its objective and methodology, I suggest you open and read the original BLOG: https://terryliebman.wordpress.com/2016/03/02/move-over-big-mac-index-here-comes-the-steak-house-index/)
Why You Should Care: The US BEA publishes GDP figures the instant they’re available. Unfortunately, it is a trailing index. The data is old news; it’s a lagging indicator. I’d sure like to know how the economy is doing in advance of the GDP release, wouldn’t you?
Personal consumption expenditures, or PCE, is the largest component of the GDP. In fact, the majority of all GDP increases (or declines) usually result from consumer spending. Clearly this is an important metric to track.
It’s my hope the SHI can help. I intend the SHI is to be predictive, anticipating where the economy is going – not where it’s been. Thereby giving us the ability to take action early. Not when it’s too late.
Taking action: Keep up with this weekly BLOG update. If the index moves appreciably – either showing massive improvement or significant declines – indicating expanding economic strength or a potential recession, we’ll discuss possible actions at that time.
The BLOG: As you know, the SHI is designed to be a weekly proxy for GDP growth. For months now, we’ve kept our finger on the pulse of consumer spending via the SHI … and now, at long last, we’ll now have a chance to see how predictive the SHI has actually been. The preliminary GDP report for Q2: 2016 is out on Friday. Two days from now.
This week, the SHI came in at a negative (-8) reading. Below, we’ll dive into comments and analysis, but I wanted to show you a graph of the SHI weekly trend over the past 32 weeks:
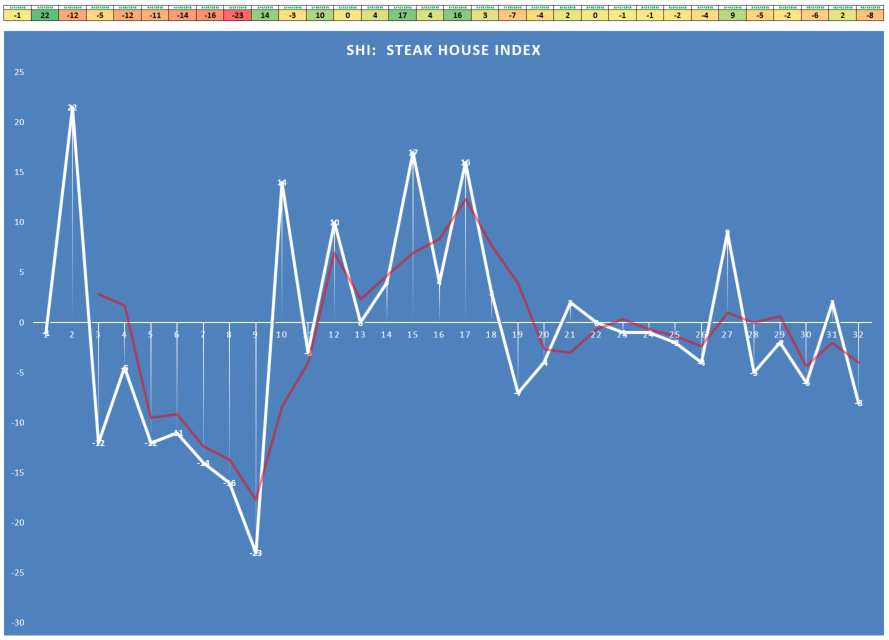
I find this very interesting. Why? Well, take a look at the red line. This is an SHI 3-month rolling average. For the last 10 or 12 weeks – to my eyes – it’s trending down. Not significantly, mind you. But down nonetheless.
Now take a look at the most recent Nowcast from the Atlanta FED:

Notice their green line? It – too – has been trending down. As of October 19th, their Nowcast for Q3 GDP growth is 2.00%. A large decline from the > 3.5% forecast in early August. This is a significant decline. And a similar trend has been noted by the New York FED:

Look at the black line above. On October 20th, their Nowcast for Q3 GDP growth rested at 2.20%. This forecast, too, has declined in the past 8-10 weeks. Not as dramatically, but similar nonetheless.
So, to summarize, the SHI, the Atlanta FED Nowcast, and the NYC FED Nowcast all suggest a weakening trend in the GDP. Don’t despair: None are forecasting a recession. But all are indicating yet another quarter of barely lukewarm economic growth. If this growth forecast was on Mastro’s menu, while it might not be ‘Steak Tartare’ it could easily be a “Pittsburgh rare”. Yeah, sorry, I’m going to let you google that one. 🙂
Above I suggested this development very interesting. Because earlier today, just two days before the first official Q3 GDP figure, a number of forecasters increasing their forecasts.
Barclays economists raised their Q3 GDP growth estimate to a 3.00% annualized rate following the government’s release of an advance report on September trade and wholesale inventories. “Exports of industrial supplies, capital goods, consumer goods, and other goods all posted solid gains on the quarter,” they commented in a research report.
The chief economist at RBS, Michelle Girard, agrees: “Based on this morning’s data, we now believe the boost from trade could be closer to a full percentage point, almost twice what we had expected.” Here’s the data she’s looking at:

The trade deficit decline of 5.2% and the inventory builds (see above), per Ms. Girard, suggests strong exports may generate a Q3 GDP growth surprise. She’s forecasting a 3.30% Q3 GDP figure.
We’ll know in two days, but I doubt it. As you know, ‘Net Exports’ – the result from subtracting total imports from total exports – is a component of GDP growth. But even if it’s positive for the quarter – which I do not expect – it’s unlikely to be a large contributor to GDP growth.
Why do I think it will be negative for the quarter? Here’s a one-year chart of the dollar index (DXY), courtesy of Bloomberg:

This quarter, the USD has increased in value against other currencies. On July 1, the DXY was 95.6. Today it stands at 98.5. This is only a 3% increase, but it means US exports have become – on the average – 3% more expensive to our trading partners around the globe. And when this happens, usually fewer exports sell.
All right, let’s head back to the steakhouse. Let’s see how Mastro’s is faring this week. Here’s the grid update from last week to today:
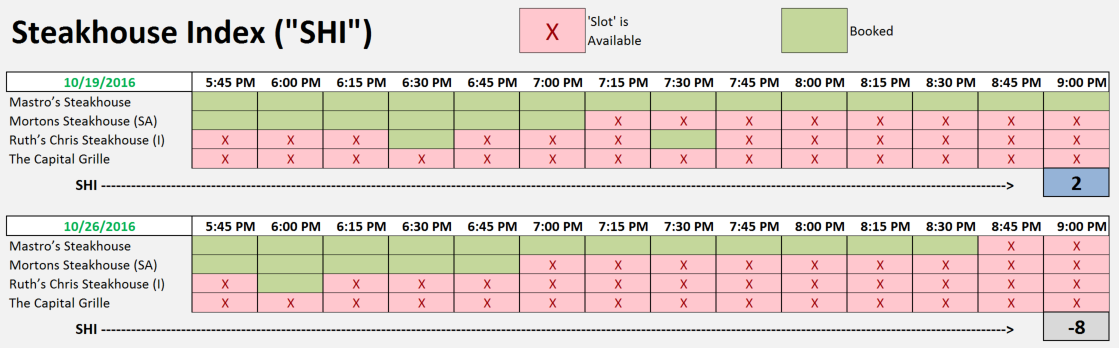
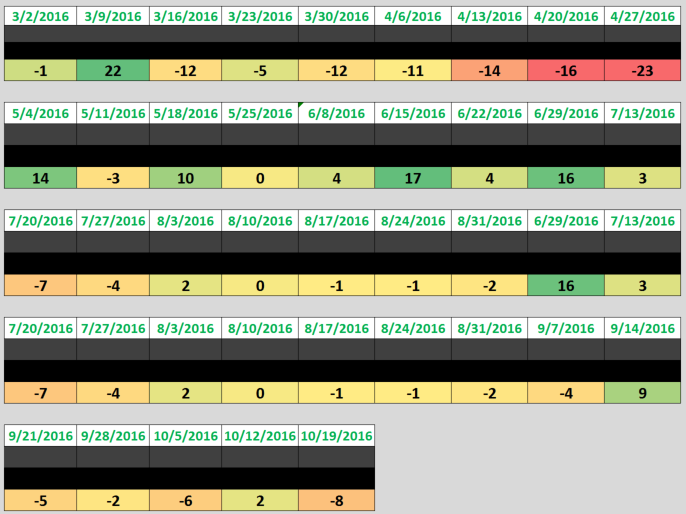
Well, if you’re looking for a table for 4 this Saturday, you’re in luck – 8:45 pm is available! And other than 6:00 pm, Ruth’s Chris is wide open as well. At Morton’s, you’re good to go after 7:00 pm. Numerically, we’ve slipped from a positive SHI reading last week of 2, down to a negative (-8) this week. Here’s our trend grid from SHI inception:
So, you may be asking, what does the SHI tell us about this Friday’s GDP number? Will it be a 3.3% barn-burner or a more tame 2.0 to 2.2% as the Nowcasts expect?
Well, you may recall a discussion about ‘Government Expenditures‘ in my SHI update back on 8/24. (Here’s the original blog: https://terryliebman.wordpress.com/2016/08/24/the-steakhouse-index-update-82416/)
From the Congressional Budget Office (CBO):
“CBO now estimates that the 2016 deficit will total $590 billion, or 3.2 percent of GDP, exceeding last year’s deficit by $152 billion. About $41 billion of that increase results from a shift in the timing of some payments that the government would ordinarily have made in fiscal year 2017; those payments will instead be made in fiscal year 2016 because October 1, 2016 (the first day of fiscal year 2017), falls on a weekend.”
It looks to me like our Q3 GDP figure should be boosted above actual economic performance by an additional $41 billion from a little bookkeeping tweak. Annualized, this amount will increase Q3 GDP by 0.89%!
I would therefore expect Q3 GDP to come in very near 3%. Aggressive, right? We’ll know on Friday! Right or wrong, one thing we know for certain: the SHI is showing a slight weakening trend in consumer spending. The SHI is telling us that US economic growth continues, albeit at a slightly slower rate.


