
The Steak House Index (SHI) Update – 10/5/16
A Race to the Bottom
October 2, 2016Steak House Index (SHI) Update – October 12, 2016
October 12, 2016Another week has passed…has the SHI made any big moves? Or does it remain as exciting as drying paint? Let’s take a look.
As always, if you need a refresher on the SHI, or its objective and methodology, I suggest you open and read the original BLOG: https://terryliebman.wordpress.com/2016/03/02/move-over-big-mac-index-here-comes-the-steak-house-index/)
Why You Should Care: The US BEA publishes GDP figures the instant they’re available. Unfortunately, it is a trailing index. The data is old news; it’s a lagging indicator. I’d sure like to know how the economy is doing in advance of the GDP release, wouldn’t you?
Personal consumption expenditures, or PCE, is the largest component of the GDP. In fact, the majority of all GDP increases (or declines) usually result from consumer spending. Clearly this is an important metric to track.
It’s my hope the SHI can help. I intend the SHI is to be predictive, anticipating where the economy is going – not where it’s been. Thereby giving us the ability to take action early. Not when it’s too late.
Taking action: Keep up with this weekly BLOG update. If the index changes appreciably – either showing massive improvement or significant declines – indicating expanding economic strength or a potential recession, we’ll discuss possible actions at that time.
THE BLOG: “Those who cannot remember the past are condemned to repeat it.” This great aphorism, courtesy of George Santayana, is worth remembering.
Especially in today’s topsy-turvy financial world. Ironically, in actuality, I’m suggesting we ‘remember’ something that has not happened before:
“One outcome of this weak economic environment and heavy reliance on unconventional monetary policies is financial markets expect negative policy interest rates in the euro area and Japan to last through the end of this decade. An unprecedented result is that almost 40 percent of advanced economy government bonds carry negative yields.”
This quote is from an IMF report, released earlier today, entitled “Low Growth, Interest Rates Impact Financial Stability.” (http://www.imf.org/en/News/Articles/2016/10/04/AM16NAGFSR100416)
No, I’m suggesting we recall an event from many years before, an event now known as the “Savings & Loan Crisis”, an unintended consequence of another FED intervention back on October 6, 1979, which ultimately destroyed the Savings & Loan (“S&L”) industry over the next 10 years.
Today, interest rates are at never-before-seen lows. Back in the 1980s, interest rates achieved never-before-seen highs. At the October, 1979 meeting, the FED dramatically raised the funds rate by 400 basis points. By April of 1980, the funds rate averaged 17.6%.
The Savings & Loan was an American fixture from early in the 19th century, and was made famous in the 1946 film, “It’s a wonderful Life.” Simply said, S&Ls made low, fixed-rate, long-term home loans. In 1975, the S&Ls had a 53% market share of all home loans. This model worked fabulously for over 150 years!
Until 1980. When the FEDs action changed the paradigm. Now the S&Ls had to pay their depositors double digit rates on their savings deposits while, at the same time, collecting single-digit rates on their home loans. They paid out a lot more than they took in.
Between 1986 and 1995, 1,043 of the 3,234 operating S&Ls subsequently failed.
I mention this because it’s worth remembering – as we now face a similar problem, only at the other end of the rate spectrum. From today’s IMF report:
“Sustained low interest rates are eroding the viability of business models for many life insurance companies and pension funds, threatening solvency over the medium term.”
Like in the ‘S&L Crisis’ of years of yesteryear, the unintended consequence of current global central bank intervention is simple. Once again, from the IMF report:
“Policyholders of existing policies with higher (rate) guarantees are more likely to keep their current contract, which increases the duration of the liability under lower and negative interest rates.”
Right. Makes perfect sense. Existing policyholders who are receiving high returns from annuities and/or other guaranteed instruments are likely to keep those in place. Further, if unable to generate the ROI needed on balance sheet assets to pay current claims, insurance companies will likely increase rates. Back in August, the New York Times ran an article entitled, “Why Some Life Insurance Premiums are Skyrocketing.” The article claimed the US life insurance industry has $6.4 trillion of invested assets – ¾ of which are in bonds.
Many of which you’ll recall are now generating negative returns.
And the problem stretches beyond our borders. The US Financial Stability Board publishes a list of “globally systemically important insurers” or “G-SIIs”. In November of 2015, they updated the list:
- Aegon N.V.
- Allianz SE
- American International Group, Inc. (AIG)
- Aviva plc
- Axa S.A.
- MetLife, Inc.
- Ping An Insurance (Group) Company of China, Ltd.
- Prudential Financial, Inc.
- Prudential plc
On the good news side of the ledger, these companies are holding their own. No, they’re not thriving. Revenues are down – but so are operating costs. For example, Prudential plc – a British firm – saw their top-line revenue fall from about 60 billion pounds to about 41 from 2014 to 2015; but, at the same time, operating expenses fell by almost 20 billion pounds. Their ‘net income’ after taxes actually increased.
How did they cut operating costs? Rest assured, their cost reductions were not accretive to the British economy.
MetLife fared better. Their 2015 income was a shade below $70 billion – down from $73 billion in 2014. And their 2015 net income exceeded $5.1 billion. Not bad. But in their 2015 public report they do comment:
“We are also one of the largest institutional investors in the U.S. with a $508.2 billion general account portfolio invested primarily in investment grade corporate bonds, structured finance securities, mortgage loans and U.S. Treasury and agency securities, as well as real estate and corporate equity, at December 31, 2015. Over the past several years, we have further diversified and strengthened our general account portfolio.”
My concern is not 2015…it’s 2016 and beyond as older bonds in their portfolio mature and they’re forced to reinvest at lower yields.
Here’s the point: This dynamic is worth watching. Closely. Should we ‘short’ the stock in these companies? If you believe interest rates will remain lower for longer – as I do – it’s an idea worth considering.
Is this a crisis – like the S&L crisis? No. I don’t think so. Sure, the dynamics are similar – opposite, but similar – and worth a careful look. But unlike the 1980s crisis where the FED funds rate peaked at 20%, while today’s rates have fallen, the declines are smaller (as a percentage of total). But over long periods of time, a lower ROI will be cumulative and deleterious.
Will this end as badly as the S&L crisis? Again, no, I don’t think so. But stay informed…keep an eye on this developing situation.
Have you worked up an appetite yet? Yes? OK…let’s head off to the steakhouses! The drama is downright heart-palpitating! (Perhaps we should avoid a steak this week … I don’t want to clog any arteries!)
Has Mastros lost its Michael Phelps-esq standing amongst our pricey eateries? Might ‘The Capital Grille’ have risen from the bottom of the pack, like the mythical Phoenix, claiming it’s share of reservations from beef-hungry Orange Countians?
No, sorry. I have nothing exciting to report this week. Yep, we’re watching paint dry here (remember: click on an image to enlarge):
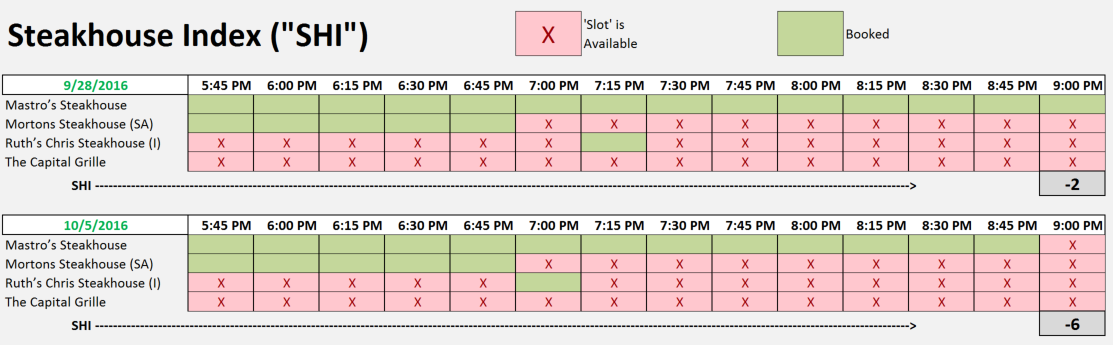
So this week the SHI has slid four points down to a minus (-6). This SHI reading, once again, supports our belief and expectation that consumer spending continues to keep US GDP growth in the ‘luke-warm’ camp. Remember: luke-warm doesn’t mean bad. It simply means the heady days of 3-4% GDP growth are unlikely at present. Alternatively, this week’s SHI suggests we’re avoiding a recession, holding steady with a 1.0-2.5% real GDP trend-line.
Let’s take a look at trending:
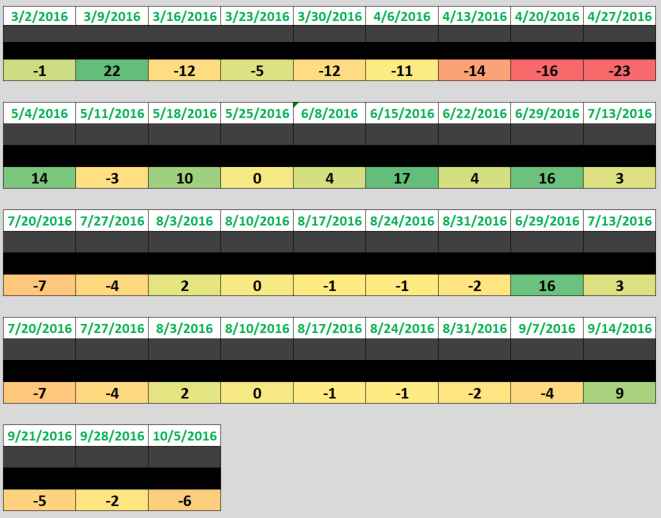
Yes, it’s easy to see the SHI is a bit range-bound at present. Holding pretty firm between zero and negative 10. Let’s graph the results and see if we can visualize the trend-line:
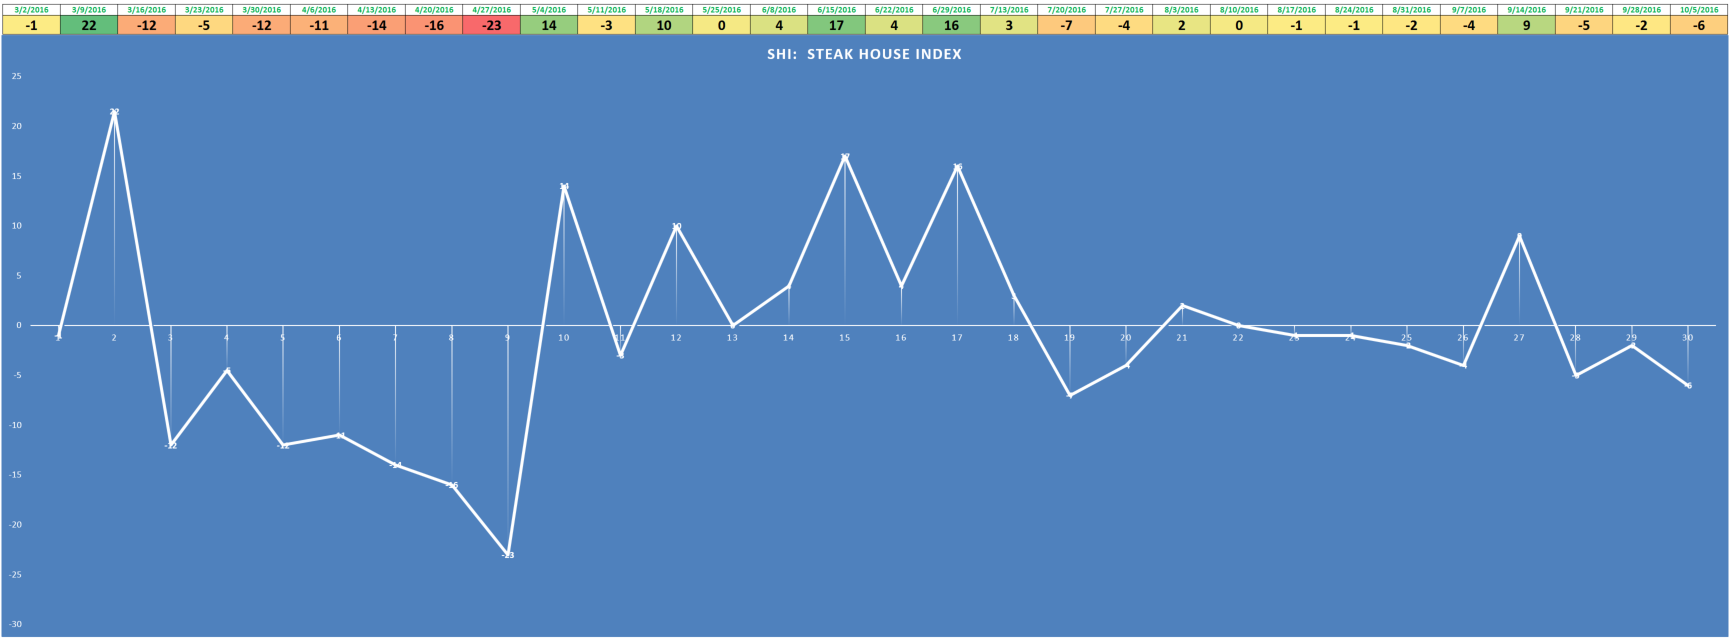
Yes, with the exception of the spike a few weeks ago, the SHI is fairly range-bound. However, to my eye it does appear to trending downward. Let’s add a 3-month moving trend-line to the graph. Take a look at the red line:
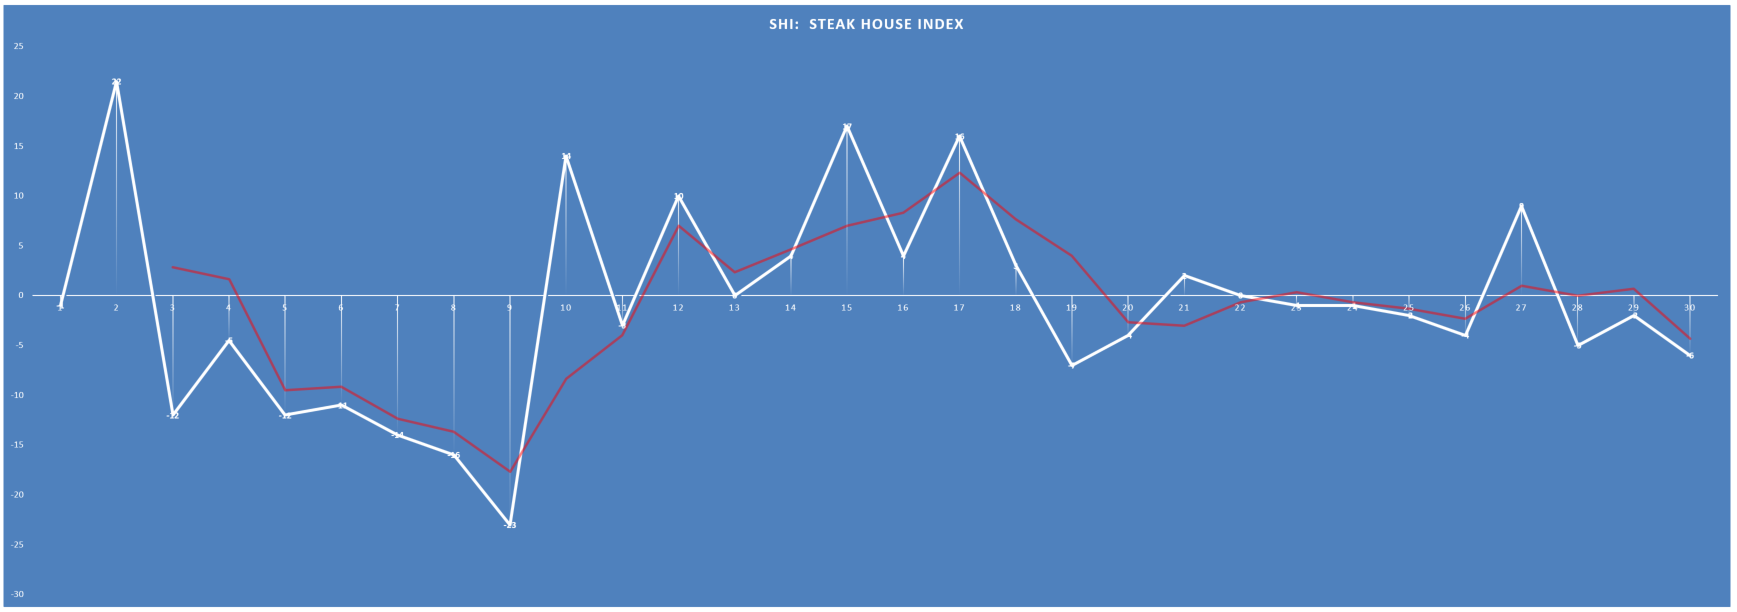
Sure enough, the trend-line is degrading. I’m not yet ready to suggest the SHI is forecasting slowing consumer spending, but we’ll be watching. Carefully.
Remember: Friday is the next installment of the ‘non-farm’ jobs report. So next week we’ll look at both the SHI and the SHCI. I can hardly wait! 🙂
- Terry Liebman

