
The Steak House Index (SHI) Update – 9/28/16
Predicting the Future
September 26, 2016A Race to the Bottom
October 2, 2016Welcome back! Yes, it’s Wednesday once again, so we’re heading back to the steakhouses! Let’s throw a New York on the grill!
Actually, if we’re interested in watching something grill, we have to go no further than the House Financial Services Committee where earlier today Janet Yellen, our FED Chairwoman, was being mercilessly flayed and grilled once again. Ouch.
If you need a refresher on the SHI, or it’s purpose and methodology, open and read the original BLOG: https://terryliebman.wordpress.com/2016/03/02/move-over-big-mac-index-here-comes-the-steak-house-index/)
Why You Should Care: The US BEA publishes the most recent GDP figures the instant they’re available. Unfortunately for us, it is a trailing index. The data is old news, a lagging indicator. I’d sure like to know in advance, wouldn’t you??
Personal consumption expenditures, or PCE, was the strongest component of the last GDP reading. In fact the majority of all GDP increases (or declines) result from consumer spending. Clearly this is an important metric to track.
I intend the SHI is to be predictive, helping us anticipate where the economy is going – not where it’s been. Giving us the ability to take action early.
Taking action: Just keep up with the weekly column. If the index changes appreciably – either showing massive improvement or significant declines – indicating expanding economic strength or a potential recession, we’ll discuss possible actions at that time.
Trending is very important…and we’ll watch the trend.
THE BLOG: Earlier this morning I was reading an IMF paper entitled, “Fading Ricardian Equivalence in Ageing Japan.” Quite a title, right? If you’re hankering to read the entire release, shoot me an email – I’ll send it right over! 🙂
Simply stated, ‘Ricardian Equivalence‘ is an economic theory which suggests ‘quantitative easing’ doesn’t work. The theory contends increased levels of government spending, funded with debt, does not increase consumer demand. It’s pretty much the opposite of the Keynesian economic theory of “priming the pump“: Stimulating the economy via interest rate reductions and government spending. QE for short.
And I loved the author’s great example of ‘economist-speak‘: “…evidence points to the possibility that an increasing number of households are liquidity constrained.”
“Liquidity constrained?” Really? I think that’s another way of saying “broke.” Are Japanese households really broke? Here are a couple of graphics the author offered up:

Well, it appears households in Japan have certainly fallen behind in savings. Japan has one of the oldest average populations of all developed nations. The chart above is, in this light, fairly disturbing.
Have pension benefits filled the savings gap for these aging folks?

It appears not. Since 1999, pension benefits (metrics are on the ‘Right Hand Side’ above) have fallen year over year too, both in nominal terms and adjusted for inflation.
With less money to spend, it makes sense that concurrent with Japan’s ever-aging households, we would expect less consumer spending, and declining GDP growth as a result. Which is precisely what’s happened. From the paper:
“Average real GDP growth declined from 4.6 percent in the 1980s, to 1.4 percent in the 1990s, and to 0.5 percent in the 2000s. The median age rose from 33 years in 1980 to 47 years in 2015, while the share of people aged 60 0r above climbed from 13 percent to 33 percent during this period.”
OK…why is this information meaningful? Well, it’s easy to see Japan’s GDP declines are highly correlated with an an aging population. During the same time when the GDP growth rate slid from 4.6% (1980s) to 0.5% (2000s), the median age increased from 33 to 47 and folks over 60 increased from 13% to 33%.
But while there is clear correlation, can we attribute causation? I believe the answer is yes. And in spite of a better savings history, the US is following in Japan’s demographic footsteps. Take a look at these population pyramids:
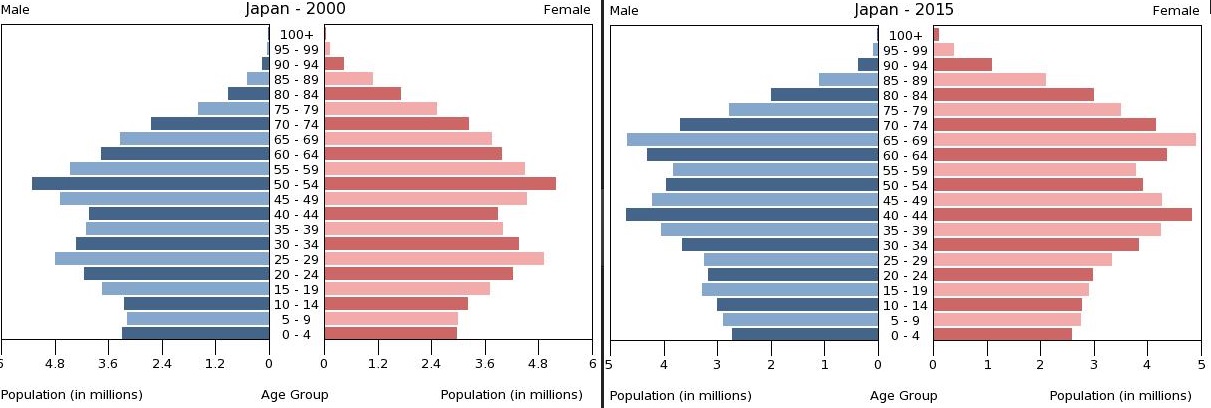
Here is Japan in 2000 … and again in 2015. Males in blue; females in red. Each horizontal bar is a 5-year age cohort. Notice the upward movement of population? It’s easy to see. Now here’s the US:

I couldn’t find 2015 – so the graphic on the right is 2014. But you can see a similar trend. Perhaps not as pronounced … but similar. To my eyes, the US demographic trends are about 10-15 years behind Japan.
My point is this: Consumer spending is an EXTREMELY important driver of GDP growth. If an aging population reduces consumption year over year, there is no amount of QE that will drive the consumption levels to maintain our historically higher levels of GDP growth. And when I say no amount, rest assured I mean within the very real inflation constraints of a developed economy.
The good news is we have the next 10 or 15 years to figure out a solution to this very real problem! This is a good time to segue back to the steakhouses!
You’d better not be “liquidity constrained” if you’re going to Mastro’s this Saturday:

Said another way, if you and your three buddies are sinking your teeth into a 48 oz Porterhouse at $99 each, you’d better bring your VISA card. Because you’ll definitely be liquidity constrained after dinner!
But plenty of our fellow ‘Orange Countians’ are salivating for a Mastro’s “Chef’s Cut” Rib Eye Chop this weekend. Because, once again Mastro’s is fully booked. The first available table for 4 on Saturday night? 9:30pm. And once again, The Capital Grill is, well, pretty empty. Let’s take a look at open tables this week vs. last week:

This week’s SHI reading of a negative (-2) is again in line with a moderate to strong level of consumer spending. And, once again, continues the consistent trend we’ve been seeing in recent weeks:
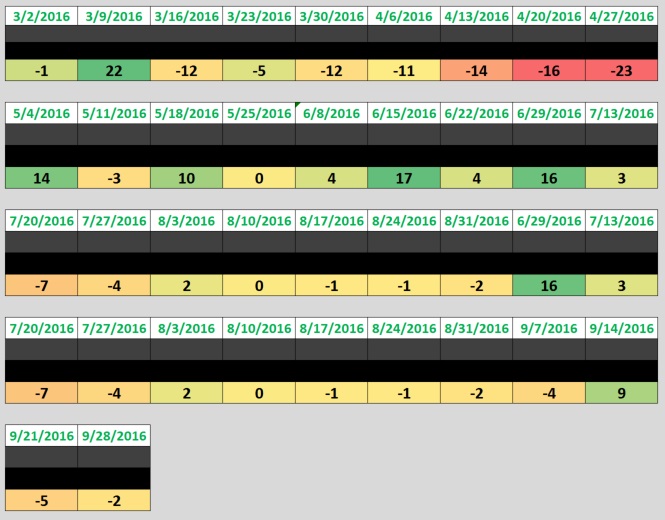
Remember: To help us easily see the trend movement, the numbers in the image above are ‘conditional formatted‘. The greener the color, the higher the SHI reading; deeper red, the lower the reading. It’s also important to repeat every number above was generated using consistent, identical methodology. The data changes weekly, the steaks remain pricey and tasty, but our process is the same.
It’s easy to see the consumer spending behavior ‘dip’ the beginning of Q2 (lots of red). Yet bookings bounced back quickly, and for the last two or three months, consumers are definitely spending money.
Arguably, if the SHI is doing it’s job, we should be seeing a solid GDP growth reading in Q3. Definitely better than Q2. The SHI is telling us the US economy remains on stable footing.
- Terry Liebman


