
SHI 7.29.26 — Fun with Numbers!

SHI 7.22.26 – Artificial Distortions
July 22, 2026
SHI 8.12.25 – The Flipside of Inflation
August 13, 2026
Ultimately, over the longer term, “earnings growth” powers all economic and financial engines, both here and abroad.
This is a foundational truth. In recent blogs, I’ve talked about corporate earnings and made my case there. If corporate earnings are growing, generally speaking we have a healthy economy.
‘Individual’ earnings – the income American citizens generate – is correlated somewhat with corporate earnings, but we see little causation there. Individual earnings, more commonly referred to as “personal income” includes all earned wages, salaries and bonuses of the 170 million or so folks in the US labor force, and investment income like dividends, interest, rental income, etc. In the aggregate, if personal income is growing, we have a healthy economy. The reason is obvious: Ignoring debt for the moment, if personal income falls, people has less money to spend on stuff. Spending declines, of course, are not good for our consumer consumption economy.
“
Earnings matter. “
“
Earnings matter. “
The big-daddy of all economic measures, I contend, remains the quarterly and annual GDP growth number. You can think of GDP as the earnings number for America.
That’s the big one — the one serious economists watch. Of course, corporate earnings and personal income figures both loom large in the GDP growth numbers. If those are both putting up healthy numbers, the next GDP reading is likely healthy as well. That is true because, as my long-time SHI readers know, personal income drives consumer consumption and consumption is responsible for about 2/3 of the US GDP.
But the other 1/3 of the GDP growth number has little, if anything, to do with consumer consumption. ‘Net exports’ of goods and services loom large in this segment of the GDP calculation. And as ‘net exports’ is the difference between all the US exports to other countries minus the stuff US consumers and companies import into the country from around the world, if imports exceed exports, the “contribution” to GDP is negative. And that’s where we’ll start today’s blog.
Welcome to this week’s Steak House Index update.
If you are new to my blog, or you need a refresher on the SHI10, or its objective and methodology, I suggest you open and read the original BLOG: https://www.steakhouseindex.com/move-over-big-mac-index-here-comes-the-steak-house-index/
Why You Should Care: The US economy and US dollar are the bedrock of the world’s economy. But is the US economy expanding or contracting?
Expanding … according the ‘advanced’ reading just released by the BEA, Q4, 2025 GDP grew — in ‘current-dollar‘ terms — at the annual rate of 5.1%.
The ‘real’ growth rate — the number most often touted in the mainstream media — was 1.40%. In current dollar terms, 2025 US annual economic output reached almost $31.50 trillion.
According to the IMF, the world’s annual GDP will expand to over $126 trillion in 2026. Of that amount, the US makes up over 25% — expected to reach $32.4 trillion by the end of 2026. Further, IMF expects global GDP to reach almost $135 trillion by 2028 — an increase of more than 28% in just 5 years.
America’s GDP remains around 25% of all global GDP. Just four countries—the United States, China, Germany, and Japan—generate roughly half of all economic activity worldwide. Collectively, the US, the European Common Market, and China generate about 65% of the global economic output. These are the 3 big, global players. They bear close scrutiny.
The objective of this blog is singular.
It attempts to predict the direction of our GDP ahead of official economic releases. Historically, ‘personal consumption expenditures,’ or PCE, has been the largest component of US GDP growth — typically about 2/3 of all GDP growth. In fact, the majority of all GDP increases (or declines) usually results from (increases or decreases in) consumer spending. Consumer spending is clearly a critical financial metric. In all likelihood, the most important financial metric. The Steak House Index focuses right here … on the “consumer spending” metric. I intend the SHI10 is to be predictive, anticipating where the economy is going – not where it’s been.
Taking action: Keep up with this weekly BLOG update. Not only will we cover the SHI and SHI10, but we’ll explore “fun” items of economic importance. Hopefully you find the discussion fun, too.
If the SHI10 index moves appreciably -– either showing massive improvement or significant declines –- indicating growing economic strength or a potential recession, we’ll discuss possible actions at that time.
The Blog:
The ‘advance estimate’ for Q2, 2026 GDP will be released by BEA tomorrow. Opinions vary on where the number will come in. The Atlanta FED has is forecasting that “net exports” will be a negative contribution to GDP growth this quarter. Perhaps by as much as 0.7% annualized. Which is why their current GDPNow forecast reflects just a 1.60% (annualized) growth rate.
I find this to be one of the most interesting nuances of the GDP calculation. As with many federal statistics, opinions differ on whether or not this approach is supported by fact. Some economic experts would like to see this changed. Me? I don’t really have a strong opinion one way or the other. As I always say, the formula design is less important than a consistent application of formula. As long as the same methodology is followed quarter after quarter, the nuance within the formula is less impactful in my opinion.
But it is an interesting nuance.
The most recent trade deficit numbers from the Bureau of Economic Analysis show the culprit in plain sight:
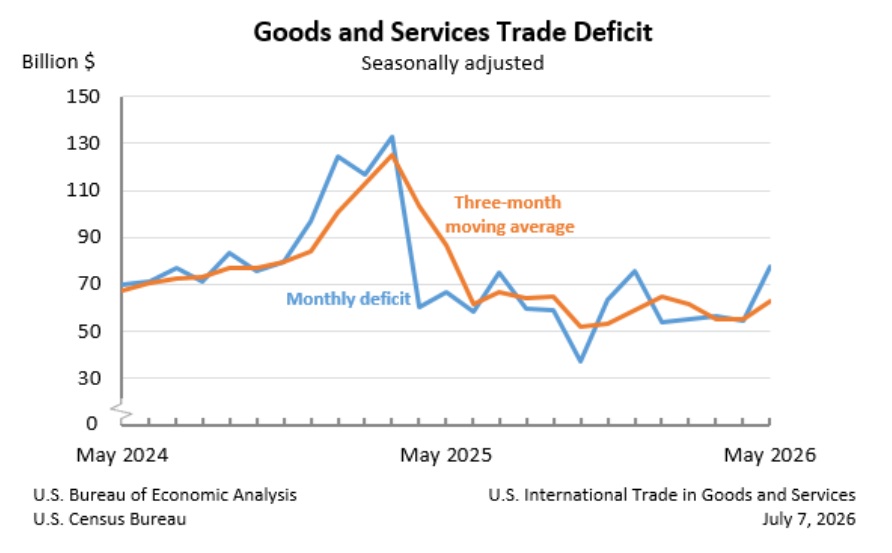
Notice that large blue-line spike in May of this year? While these imports simply show up on paper as a larger trade deficit there’s a big difference from a few years ago: These imports are not cheap foreign consumer goods. These are “capital goods” imports. The import surge wasn’t televisions and sneakers — it included an extraordinary volume of machinery, semiconductor equipment, AI servers, electrical infrastructure, and factory equipment. Sure, those imports temporarily widened the trade deficit and will definitely reduced current GDP readings, but they also became the factories, data centers, and productive assets that will generate output for years to come.
Of course, we’ll know tomorrow. And it’s very possible this quarter’s GDP may be depressed by the very investments that are laying the foundation for tomorrow’s outsized growth. Because the fact is that while imports of ‘AI infrastructure’ parts and components subtract from today’s GDP reading, they do become the productive assets that will drive future output.
Consider this interesting example. Imagine that Dell Computers buys HBM (high bandwidth memory) chips from a US Micron factory here in the US for inclusion in a new PC ultimately sold to a US consumer. In this instance, the sale proceeds are counted in that quarter’s GDP. However, if that same transaction included HBM purchased from SK Hynix that was manufactured in South Korea, the cost of that HBM is deducted from GDP. Because the SK Hynix HBM is an “import” and, according to the formula, that portion of the sale price of the PC must be subtracted from GDP.
So imagine two identical chip transactions. The only difference where the chip is manufactured. A domestic manufacturer contributes to GDP. A foreign maker reduces GDP. Even though both are PCs sold by Dell at identical prices with identical components. The only appreciable difference is the Micron chipset is in the first PC and the SK Hynix is in the second. So we have identical sales … but according to the GDP calculation and current economic theory, the PC sold with the Micron chipset is more “valuable” to America, thru the lens of the GDP calculation.
Interesting, right? Now, let’s tweak the story just a bit. In the first transaction, we have the same PC we discuss above. Dell … Micron .. etc … 100% of the sale price is included in the GDP calculation. But in the second PC, this time we have SK Hynix HBM chips that were manufactured in a US factory. Yes, a US factory. Owned by SK Hynix. In this instance, both transactions are identical and 100% of the sale proceeds from both PC sales are part of GDP. And as that factory is physically located in the US, then their HBM chips are not an “import” and, thus, are included in the GDP calculation.
And this, my friends, is why the Chips Act was a critically important piece of legislation. No, there are many parts of the Act I am not a fan of, but its an important building block in the on-shoring of high-quality, highly technical manufacturing here into the US. Commerce Secretary Lutnick agrees and clearly he is working hard to locate as many high-quality manufacturing facilities as possible inside the borders of the US. Among other things, US GDP growth demands these high-tech factories to be located here. Not only are the components manufactured and sold on US soil included in the GDP calculation, any exports sold to other countries are also included. This fact is clear: The lower the dollar value of imported high tech components, the greater the US GDP.
All this begs the question: Is SK Hynix planning to locate an HBM chip plant here in the US? Yes, in fact, they are. Construction began earlier this year with completion targeted for the second half of 2028. When fully operational, it is estimated that the facility will employ approximately 1,000 people.
The almost $4 billion SK Hynix plant currently under construction in Indiana will perform the highly sophisticated “advanced packaging” process that turns memory dies imported from South Korea into HBM stacks. “Advanced packing” is one of the highest-value portions of the semiconductor supply chain. Moving this process to U.S. soil injects revenue into the GDP calculation. It’s exactly the type of investment that policymakers hope will increase domestic manufacturing value added, even if the silicon wafers themselves continue to be fabricated overseas. The entire chip manufacturing process may not happen on us soil, but a significant portion of the “value add” will.
Of course, they are not alone. Factories are popping up all across the US. The list is quite long and growing. Our growing “bag of chips” includes the TSMC plants in Phoenix; Micron’s facilities under construction in upstate NY; Intel expansion; Samsung in Taylor, TX; expansion at Texas Instruments; and numerous others.
All told, the semiconductor factory growth is close to $700 billion. Tossing in all the AI datacenters and related infrastructure and other advanced manufacturing on-shoring efforts, the number balloons to close to $2 trillion. In addition to the GDP spike from the current capital outlay now, once these facilities are fully operational, they could contribute up to 1.50% per year to US GDP growth. Every year.
For now, let’s get back to current conditions. Tomorrow’s Q2 GDP number will likely be depressed due to the import of capital goods. You can watch it unfold on CNBC at 5:30 am. I’ll be watching. 🙂
Oh. What’s the cause of that “big bump” in the graph back in early 2025 you ask? How quickly we forget. That was the import surge triggered by the original Trump tariff program. Many American companies “pulled forward” imports with the hope of avoiding tariffs, resulting in the massive trade-deficit mountain we see in the graph.
To the steakhouses?
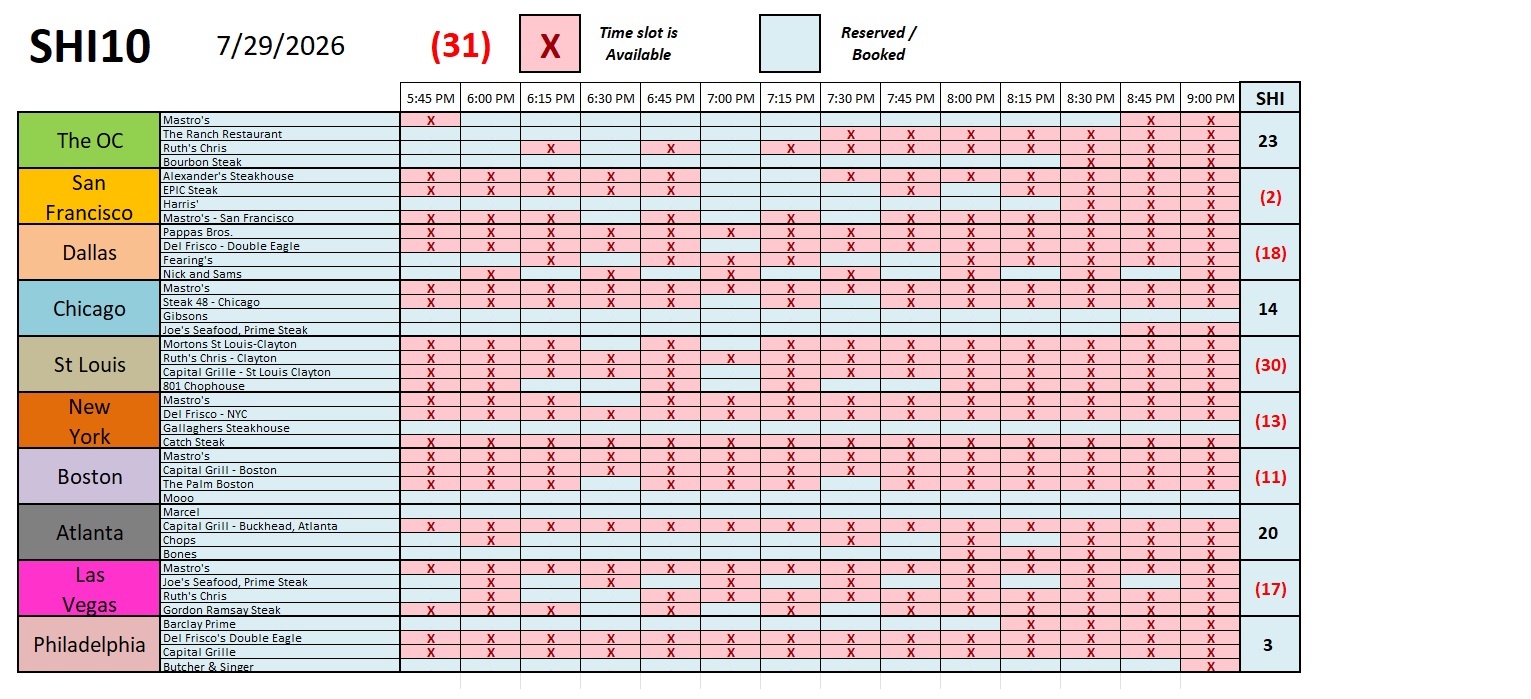
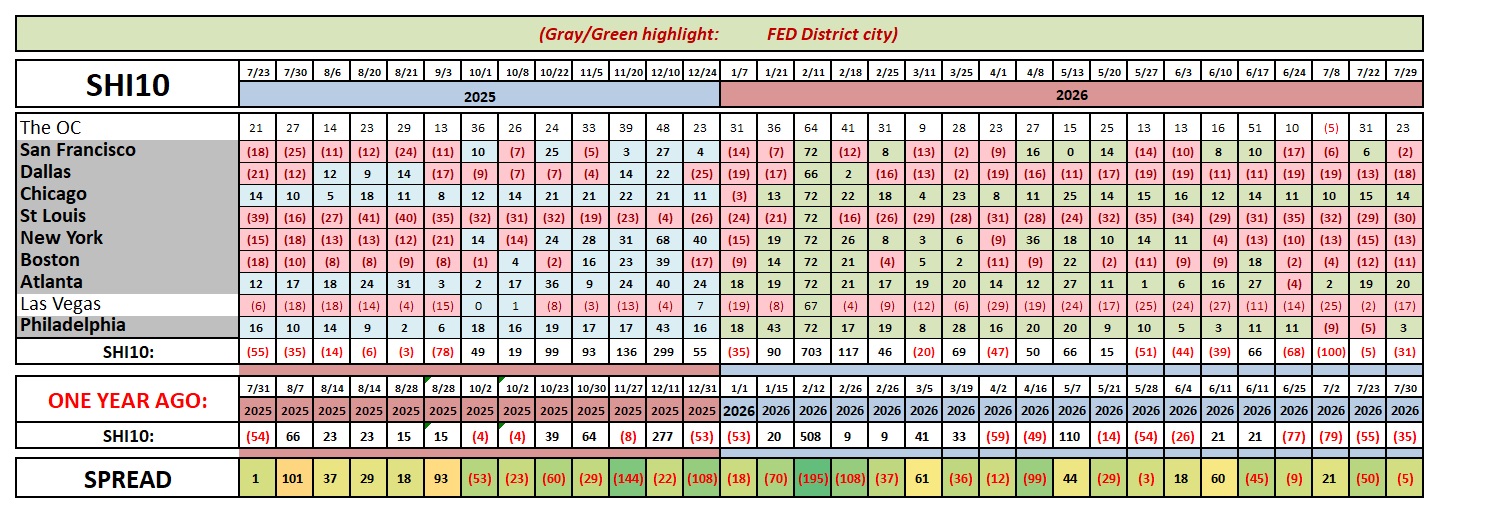
Reservation demand is marginally weaker this week than last. But there’s no appreciable different in the SHI40. Nothing to see here, folks. Sorry.
Earlier today, the FED announced they left the Federal Funds rate unchanged. Interestingly enough, there was some dissent on the committee — the vote was 9 to 3 in favor of holding rates steady. I was not surprised by the decision or the dissents. In the press conference following the release of the FED decision, Kevin Warsh made some opening comments before the traditional Q&A attended by economic experts from around the world. Here’s one of Warsh’s comments from earlier today.
“CapEx is preparing the ground for future growth,”
reflects what I feel is one of Warsh’s foundational beliefs that future strength and growth are far more certain underlying the extensive capital investment regime we’re seeing across the US today.
Many may wonder why Warsh didn’t raise rates today. I don’t. In a 2025 WSJ opinion piece, Warsh commented, “AI will be a significant deflationary force.” I suspect Warsh believes raising interest rates now would have as much impact on inflation as pushing on a rope. That is to say almost none.
However, if the significant CapEx boom contributes to a sizable productivity boom in the mid-term, I’m guessing Warsh probably believes this will have a much greater impact on both wages and inflation.
Thanks for tuning in.
<> Terry Liebman <>