
SHI 10.5.22 – Chaos in the Kitchen

SHI 9.28.22 — Rhymes With Dread
September 28, 2022
SHI 10.26.22 – The Fast, The Slow, and The Downright Sloth-Like
October 26, 2022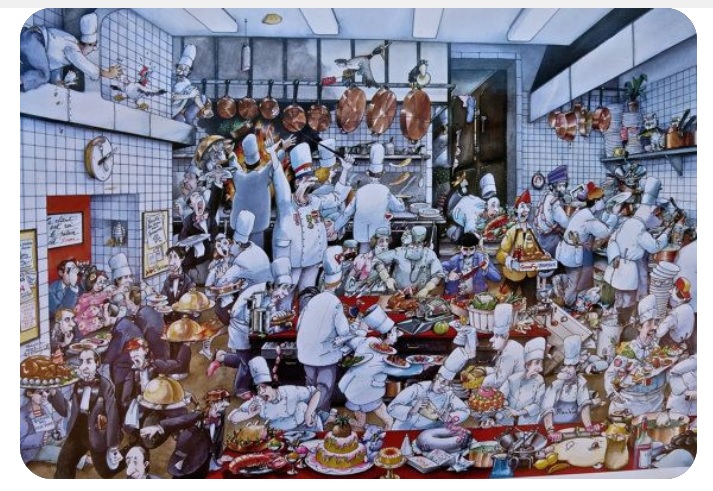
Covid really screwed the restaurant business.
Here in the US, only a few business channels were harder hit during the pandemic. Then, as Covid-effects waned, labor challenges bloomed. Restaurant staff and servers became near-impossible to find. And the final 1-2-3 punch was ‘food price inflation’ which, according to the CPI-U, was up 11.4% in the 1-year from August ’21 to August ’22. All of which begs the question:
“
How are restaurants holding up post-Covid?”
“
How are restaurants holding up post-Covid?”
And, further, what intelligence – if any – can we glean from current data about the general economy? Plenty it turns out. Fortunately for us, OpenTable has laid quite a bit of data on the table for us to cut into. So grab your knife and fork, and perhaps a glass of your best Chateau Petrus, and let’s slice into the meat of the matter.
Welcome to this week’s Steak House Index update.
If you are new to my blog, or you need a refresher on the SHI10, or its objective and methodology, I suggest you open and read the original BLOG: https://www.steakhouseindex.com/move-over-big-mac-index-here-comes-the-steak-house-index/
Why You Should Care: The US economy and US dollar are the bedrock of the world’s economy.
But is the US economy expanding or contracting?
Expanding. Sort of. At the end of Q2, 2022, in ‘current-dollar’ terms, US annual economic output rose to $24.85 trillion. Yes, during Q1, the current-dollar GDP increased at the annualized rate of 7.8%. The world’s annual GDP rose to about $95 trillion at the end of 2021. America’s GDP remains around 25% of all global GDP. Collectively, the US, the euro zone, and China still generate about 70% of the global economic output. These are the 3 big, global players.
The objective of this blog is singular.
It attempts to predict the direction of our GDP ahead of official economic releases. Historically, ‘personal consumption expenditures,’ or PCE, has been the largest component of US GDP growth — typically about 2/3 of all GDP growth. In fact, the majority of all GDP increases (or declines) usually results from (increases or decreases in) consumer spending. Consumer spending is clearly a critical financial metric. In all likelihood, the most important financial metric. The Steak House Index focuses right here … on the “consumer spending” metric. I intend the SHI10 is to be predictive, anticipating where the economy is going – not where it’s been.
Taking action: Keep up with this weekly BLOG update. Not only will we cover the SHI and SHI10, but we’ll explore “fun” items of economic importance. Hopefully you find the discussion fun, too.
If the SHI10 index moves appreciably -– either showing massive improvement or significant declines –- indicating growing economic strength or a potential recession, we’ll discuss possible actions at that time.
The Blog:
First, an announcement: The SHI team will not produce updates on 10/12 or 10/19. Sorry, but we wanted to make sure you don’t get a hankering for a steak-house update that we can’t fulfill. We’ll be back on the 26th. And I apologize for the late post of this blog. Technical issues. What can I say?
Restaurants are the ‘life-blood’ of OpenTable. OT assiduously tracks restaurant data. In their “State-of-Industry” site, they offer us data providing a solid view into the pre-, during- and post-pandemic state of the restaurant industry as a whole. And their data set is huge:
“To better reflect the state of the industry overall, this dataset is based on a sample of approximately 20,000 restaurants that provide OpenTable with information on all of their inventory in states or metros with 50+ restaurants on the OpenTable network. This sample of restaurants typically accounts for a majority of our seated online reservations.”
Have you been to the OT data site? If time permit, check it out (right click, open a new tab.)
https://www.opentable.com/state-of-industry
Here’s some data I found fascinating. Let’s begin with this image from the site:
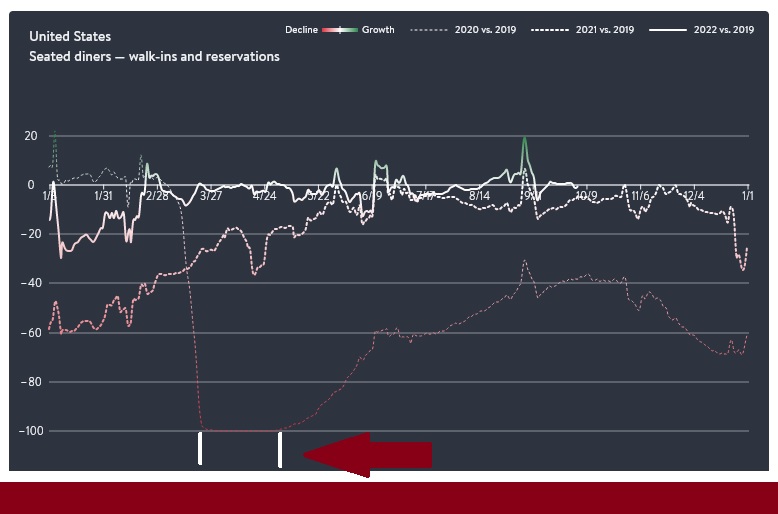
Let’s start with the info at the top (right). The ‘color’ data indicates ‘growth’ – we see small amount of green and a whole lot of red.
The red – which the site defines as a “decline” – is quite prevalent in the very ‘lite’ dotted line, which compares 2020 to 2019. Except, of course, for the brief period between January 1st of 2020 and the end of February, a briefly “normal” period just before the pandemic really took off. Beginning in March of 2020, the number of “seated diners” in US restaurants literally dropped off a cliff. The red arrow (I added) at the bottom of the image highlights a period from around March 1st thru the beginning of May when, as we see above, restaurants experienced a near 100% decline in seated diners. Of course, we all know why. Most restaurants were closed. Doors shuttered.
Fast forward to today. Take a look at the “solid” line in the image. This graph-line compares “butts-in-seats” (let’s call this metric “BIS”) data from 2019 to the same day of the week in 2022. Note the line stops right around today’s date – October 5th.
What we see above is an interesting trend line. Based on the almost 20,000 restaurants that provide OpenTable with data on all of their seats/tables in American states or cities with 50 or more restaurants on the OT network, 2022 started out a bit rocky. The number of BIS was down about 20% thru mid-February.
And then, as we see, 2022 closely mirrored 2019 until early September, when the number of diners briefly spiked to 20% above 2019 numbers. Green shoots! But they seem to have died off quickly around the same time the FED kicked-off their new tightening policy and rate hikes.
Permit me to summarize what I see here. Bottom line, the BIS trend has generally improved all year during 2022 over the most recent “normal” calendar year. But even as the trend was generally improving, we don’t see a significant spike in America-wide restaurant demand. In fact, by the numbers, 2022 is closely reminiscent of 2019. ‘Consistent’ is the word I’d use to describe what I see here when we compare the pre-pandemic demand to the normalized, post-pandemic state.
What I don’t see is an “overheating” in restaurant demand. Perhaps this is an ironic choice of words, as we’re discussing chaos in the kitchen today. But chaos in the America’s restaurant kitchens, in some respects, may have been partially responsible for an overheating in the US economy, if we are to believe the FED. Perhaps it was. It is possible the economy was “running hot” – and perhaps the FED actions YTD in 2022 had the desired effect dampening restaurant demand and attendance country-wide, but that conclusion is not obvious here.
What is clearly obvious is the fact that the vast majority of 2020 was horrible for restaurant owners. As was the first ½ of 2021. In fact, I think we can closely inversely correlate Covid spikes with declines in restaurant demand. No big surprise here, right? But with 2022 closely tracking 2019, it’s hard to glean any actionable intelligence here.
How representative is the BIS metric for the US economy as a whole? An interesting question.
The SHI theory contends that reservation demand at expensive eateries is an excellent alternative economic metric, predictive of general US economic activity. The SHI uses a data set from the same time and day every week and compares this data to the same time and day from prior years. Just like the BIS. Like the SHI, the BIS data set follows a stringent set of controls. This is a good thing.
However, unlike the SHI, the BIS metric covers all restaurants on the OpenTable platform. Not just the most elite of the elite steakhouses across the US. The SHI contends that this group of well-off individuals will the last group to modify their consumption behavior as the economy wanes, probably well after BIS numbers suggest a slowing-trend in restaurant dining demand.
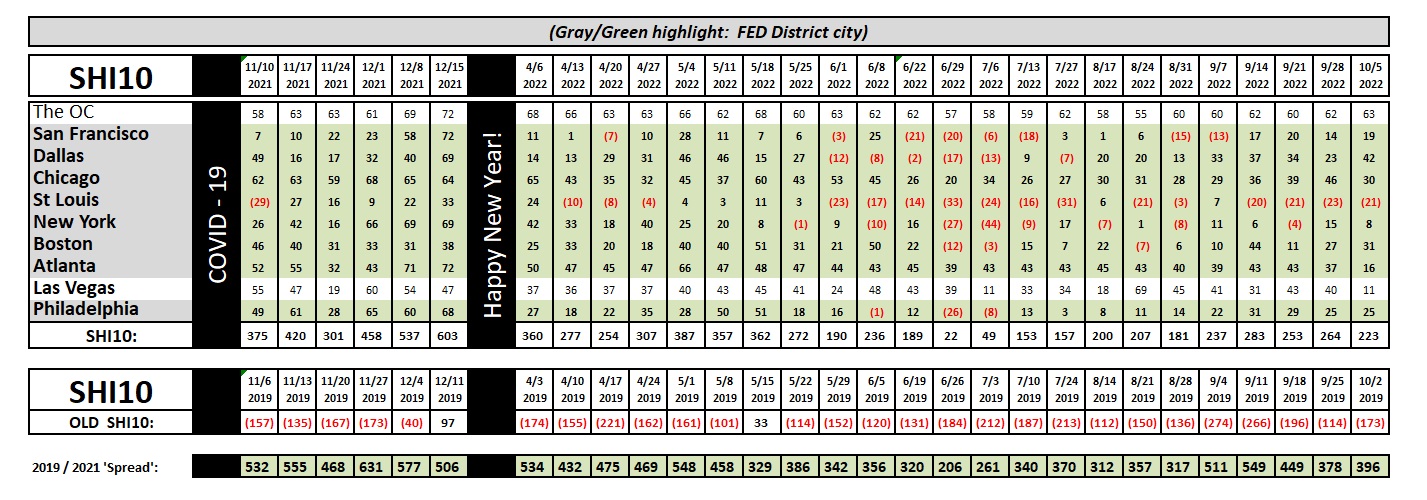
Interestingly enough, neither the SHI or the BIS reflect slowing demand at this time:
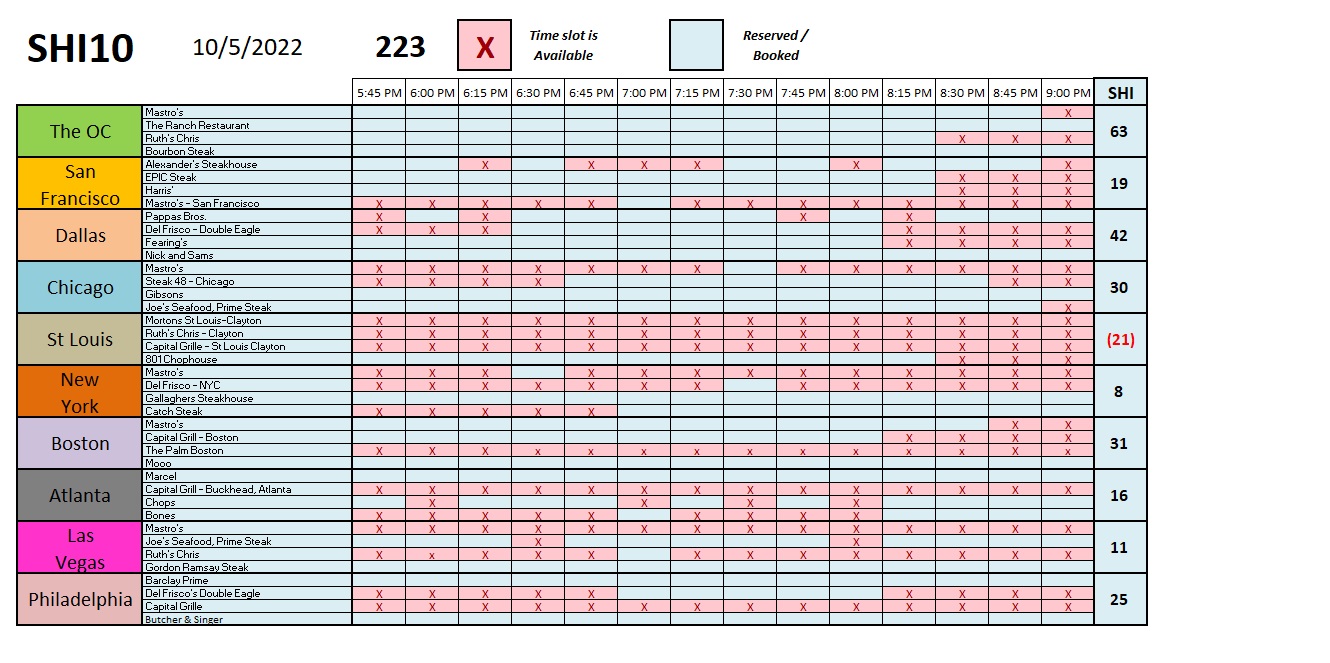
With a weekly reading of 223, today’s SHI remains consistent with prior weeks. I see no noticeable trends in any of the 10-SHI cities we track. There is one rather interesting development, however: Until today, the “Bones” Steak House in the tony ‘Buckhead’ area of Atlanta has been consistently booked solid, week-after-week. Until today. For the first time in recent memory, the restaurant has reservation openings for Saturday evening. By the numbers, Atlanta reservation demand softened this week. Is this an aberration or a trend? Time will tell. There is a bit of softening in the ‘Vegas marketplace too; St Louis remains weak; but, generally, the other SHI cities look fairly consistent, week-over-week.
In concert, collectively the central bank-interest rate hikes are beating-up the global economy like a crowbar crushing a Volkswagen headlight. The damage is obvious, but so far, at least, the car can still drive fine. During the day, anyway.
But the United Nations doesn’t agree. They are pleading for relief: Just days ago, the UN made a public statement that the correlation and speed of the rate increases risks “prolonged stagnation” and a global recession. The UN wants the beatings to stop … or at least, slow. Before they do permanent damage.
Perhaps. But for now, our Steak House Index and Butts-in-Seats metric suggest otherwise. Both metrics reflect a healthy consumer marketplace. At least here in the United States. For now. But it’s wise to remember that the FED still firmly holds that crowbar … and, for some reason, they seem angry and intent to continue shattering the other headlight … and maybe even the windshield.
However, that said, I believe I’m seeing pressures build for a near-term rate hike pause. The pressures are not from within the FED itself, mind you: The FED Governors are all singing from the same Hymnal. No, the cacophony is from other dollar-centric countries and economic organizations who find themselves swamped or struggling in the outsized wake of the FEDs rapid rate hikes. I think the chances are improving that the FED may soon listen and see reason to slow in the near future.
Almost a century and a half ago, there lived a rather famous financial journalist named Walter Bagehot. A brilliant man, often quoted, he uttered the perfect quip to sum up today’s environment:
“A uniform remedy for many diseases often ends by killing the patient.”
Here’s to hoping the FED soon puts down the medicine spoon and steps back from the patient. It’s time to wait and see if the already-dosed medication did the trick.
<:> Terry Liebman


