
SHI 11.3.21 – “The Tales of my Demise …

SHI 10.27.21 – Common Prosperity Crushes the Ant
October 27, 2021
SHI 11.10.21 – Have You Heard About Inflation?
November 10, 2021
… are greatly exaggerated,” was Samuel Clemens’ reply – we know him as Mark Twain – when asked to comment on the rumor that he had died. Just as Twain was still with us then, so is the robust post-covid economic expansion now. The Q3, 2021 GDP ‘advance’ estimate, released by the BEA last Thursday, has been interpreted by many as evidence of the demise of the hyper-growth cycle fueled by the unprecedented combination of fiscal and monetary stimulus. Don’t believe it. The hyper-expansion, while temporarily in hibernation, will come roaring back in Q4 and the first ½ of 2022.
“
The Expansion Lives!.“
“The Expansion Lives!.“
Don’t get caught up in the naysayer rhetoric.
Sure, back on August 13th, the 36 “professional forecasters” surveyed by the Philadelphia FED predicted Q3 GDP would clock in at an annual rate of 6.8% — down 0.7% from the prior survey. And, sure, about a month and a half later they were wrong – very wrong. The number released by the BEA on October 28th was only 2%; and now, many economists are quickly backpedaling, opining that the hyper-expansion is over. Many are now suggesting future US GDP growth will be much closer to it’s long-term trend of 2%.
Nothing could be further from the truth. Don’t believe the naysayers. Tales of this expansion’s demise are greatly exaggerated.
Welcome to this week’s Steak House Index update.
If you are new to my blog, or you need a refresher on the SHI10, or its objective and methodology, I suggest you open and read the original BLOG: https://www.steakhouseindex.com/move-over-big-mac-index-here-comes-the-steak-house-index/
Why You Should Care: The US economy and US dollar are the bedrock of the world’s economy.
But is the US economy expanding or contracting?
Expanding. Significantly. In fact, in the 6 months of Q2 and Q3, growth nominal terms exceed $1.1 trillion of economic activity. The world’s annual GDP is expect to end 2021 near about $93 trillion. Annualized, America’s GDP settling in at $23.17 trillion — still around 25% of all global GDP. Collectively, the US, the euro zone, and China still generate about 70% of the global economic output. These are your big players.
The objective of this blog is singular.
It attempts to predict the direction of our GDP ahead of official economic releases. Historically, ‘personal consumption expenditures,’ or PCE, has been the largest component of US GDP growth — typically about 2/3 of all GDP growth. In fact, the majority of all GDP increases (or declines) usually results from (increases or decreases in) consumer spending. Consumer spending is clearly a critical financial metric. In all likelihood, the most important financial metric. The Steak House Index focuses right here … on the “consumer spending” metric. I intend the SHI10 is to be predictive, anticipating where the economy is going – not where it’s been.
Taking action: Keep up with this weekly BLOG update. Not only will we cover the SHI and SHI10, but we’ll explore “fun” items of economic importance. Hopefully you find the discussion fun, too.
If the SHI10 index moves appreciably -– either showing massive improvement or significant declines –- indicating growing economic strength or a potential recession, we’ll discuss possible actions at that time.
The Blog:
First, permit me an apology: I am heading to the airport shortly and, as a result, an updated SHI10 will have to wait a week. Sorry about that.
But before I leave town, I had to comment on all the hand-wringing over the just released Q3 GDP number. I’ve read story after story, ad nauseam, about how the post-Covid, US economic hyper-expansion is either dead or dying. Here’s one author’s comment I enjoyed a lot, focused on the stimulus payments:
“… the extra spending was like an opioid given to a car crash victim, temporarily masking the economic pain caused by government-imposed shutdowns. Ultimately, there is no free lunch when it comes to spending, and the economic bill is already starting to come due.”
The author suggests this is the reason why Q3 GDP growth was only 2%. And, further, why the expansion is decelerating … and possibly dying. The author couldn’t be more wrong. First, let’s consider this data, directly from the BEA website:
“Current-dollar GDP in Q3 increased at 7.8% annually, or $432.5 billion, to a level of $23.17 trillion. In the second quarter, GDP increased 13.4%, or $702.8 billion.”
Doing the math, we have a $1.135 trillion increase in nominal GDP in just 2 quarters. Let me say that another way: In just 6 months, the value of US economic output increased by more than the total market capitalization of Tesla. Or about ½ of Apple. In just 6 months!
OK, nominal GDP, as we all know, is not ‘real’ GDP. And GDP, after adjustment for inflation, did grow just a paltry 2% during Q3. But consider this: We live in a ‘nominal’ world. Meaning, all our purchases, expenses, assets, etc., are measured in ‘current-dollars’ — not inflation-adjusted dollars. Current-dollar GDP grew at 7.8% in Q3 — a huge accomplishment given the headwinds and challenges. Only after a 5.7% reduction for the “GDP deflator“does the growth seem paltry. These facts don’t get the headlines. “Falling GDP growth” does.
Remember: The FED continues to believe – as do I – that today’s inflation is transitory, probably the result of bottlenecks, shortages, supply chain problems, etc. Ultimately, I believe today’s inflation spikes distill down to a supply/demand dislocation. Strong demand is definitely overpowering global supply.
Q3, 2021, was probably Covid’s last big surge. When June ended, many around the world rejoiced as Covid case numbers fell … but Delta came roaring back like a lion a month later in July and, once again, Covid closures, disruption and fear flourished again. No longer. Now, solidly into Q4, many of those disruptions are a thing of the past, which means all Americans can get out, spend their savings and have some fun.
Well, maybe a little. The supply chain problems remain … and there is no quick fix. I contend our transitory inflation problem has two primary drivers: First, goods and material shortages caused by the global supply chain problems are real. Second, labor disruptions due to retirements, geography, training/education, and Covid have tilted pricing power to labor. And to their credit, they are using this opportunity to renegotiate the cost of labor upward. As they should. But this, too, is transitory. Meaning not that the price of labor will decline in future years. No, that is unlikely. But the rate of labor cost increases – wage inflation – will likely slow and return to its longer-term trend line in the coming years. Albeit at a higher cost plateau than today.
In fact, even without supply chain problems, the exceptionally strong consumer demand caused directly by government Covid stimulus payments would probably have generated a similar problem. With today’s supply problems, and exceptionally strong consumer demand, and inflation in goods and services was inevitable. But it’s likely temporary, or transitory, as the FED likes to say. Once the supply-side of the equation is fixed, this dislocation will likely end. And inflation, I believe, will revert to the mean.
Remember that not only are consumer savings accounts still flush with cash, but across the country revolving credit balances are down significantly. Take a look at this graph, courtesy of FRED at the St Louis FED, covering the past 5 years, updated just days ago:
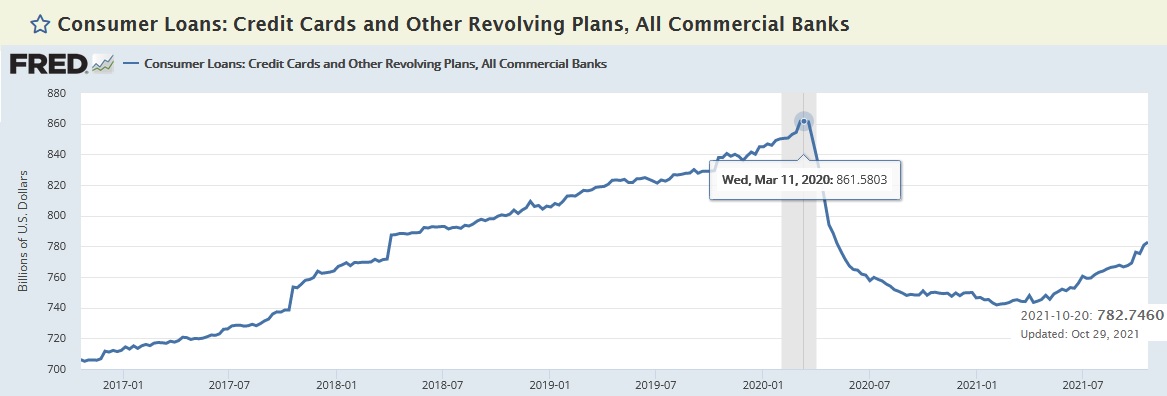
Clocking in today at slightly more than $782 billion, credit card balances today are 9% below the pre-pandemic peak. Not only are consumer savings still exceptionally high, but consumer credit debt is exceptionally low. Both translate to a ton of consumer spending power.
On top of the pile of savings and lower credit card debt, we can add lower mortgage payments. According to the US Census Bureau, about 65% of all American families own their own home. And while home values are up quite a bit, interest rates are not. According to Freddie Mac, a significant number of those homeowners have refinanced their debt at much, much lower rates:
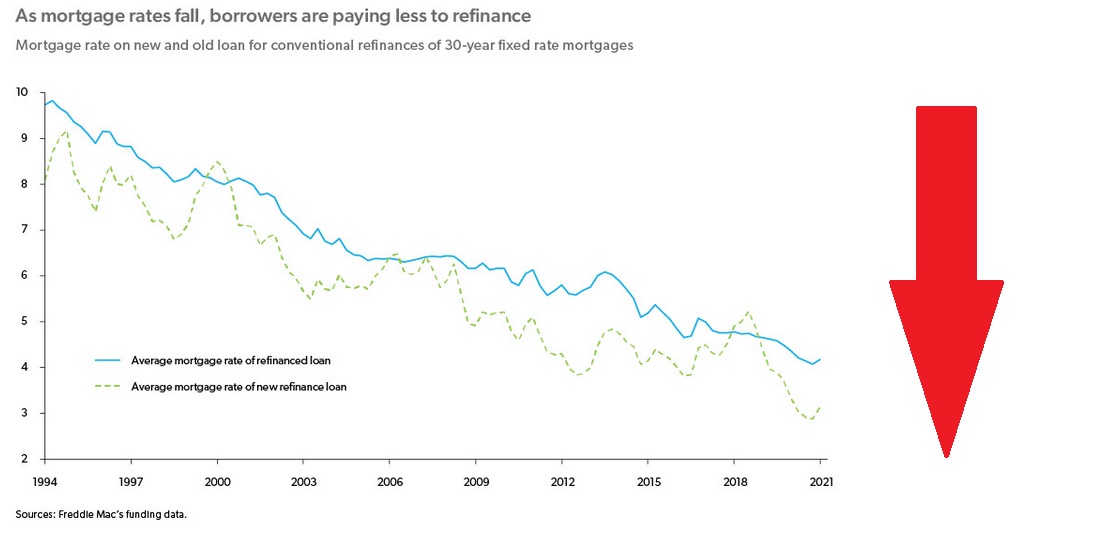
Finally, according to the ‘Data & Analytics‘ division of Black Knight, Inc, while about $300 billion has been liberated from home equity “cash out” refinances in the past year or two, and deposited into savings accounts, the weighted average CLTV of US housing debt remains exceptionally low — at only 46%.
Which, once again, translates to increased buying power.
Why didn’t these “tailwinds” work during Q3? Why was the ‘real’ GDP reading only about 2%? I suspect Covid shutdowns and media-fanned fear tends to dampen consumption.
I expect consumer spending, and our economy will come roaring back in Q4.
Do not bet against this expansion. I fear that would be a bet you would lose. The size and duration of US economic growth in the coming quarters, I feel, will surprise us all.
<:> Terry Liebman


