
SHI 12.19.18 – Spend Like There’s No Tomorrow

SHI 12.12.18 – The Wealth Effect
December 12, 2018
SHI 1.2.19 – Happy Gnu Year!
January 2, 2019
“Money makes the world go ’round.”
Or so sang Liza Minelli and Joel Grey in the 1974 movie ‘Cabaret!’ Never seen it? Let’s change that right now:
https://www.youtube.com/watch?v=PIAXG_QcQNU
Money, money, money, money. And debt. Lots of debt. Debt is piling up. According to a report from the Institute of International Finance (IIF), global debt has increased by $150 TRILLION in the past 15 years! Holy cow! Do you know how many Mastro’s Filets you could buy with $150 trillion? Should we be concerned? Is the FED concerned?
The FED completed their last 2018 meeting just minutes ago. What did the FED have to say about interest rates, inflation, debt levels and Filet Mignon?
Welcome to this week’s Steak House Index update.
If you are new to my blog, or you need a refresher on the SHI10, or its objective and methodology, I suggest you open and read the original BLOG: https://www.steakhouseindex.com/move-over-big-mac-index-here-comes-the-steak-house-index/
Why You Should Care: The US economy and US dollar are the bedrock of the world’s economy. This has been the case for decades … and will continue to be true for years to come.
Is the US economy expanding or contracting?
According to the IMF (the ‘International Monetary Fund’), the world’s annual GDP is about $80 trillion today. US ‘current dollar’ GDP now exceeds $20.66 trillion. In Q3 of 2018, nominal GDP grew by 4.9%. We remain about 25% of global GDP. Other than China — a distant second at around $11 trillion — the GDP of no other country is close.
The objective of the SHI10 and this blog is simple: To predict US GDP movement ahead of official economic releases — an important objective since BEA (the ‘Bureau of Economic Analysis’) gross domestic product data is outdated the day it’s released. Historically, ‘personal consumption expenditures,’ or PCE, has been the largest component of US GDP growth — typically about 2/3 of all GDP growth. In fact, the majority of all GDP increases (or declines) usually results from (increases or decreases in) consumer spending. Consumer spending is clearly a critical financial metric. In all likelihood, the most important financial metric. The Steak House Index focuses right here … on the “consumer spending” metric. I intend the SHI10 is to be predictive, anticipating where the economy is going – not where it’s been.
Taking action: Keep up with this weekly BLOG update. Not only will we cover the SHI and SHI10, but we’ll explore related items of economic importance.
If the SHI10 index moves appreciably -– either showing massive improvement or significant declines –- indicating growing economic strength or a potential recession, we’ll discuss possible actions at that time.
The BLOG:
Here’s a great graphic, courtesy of Bloomberg and based on data from the IIF:
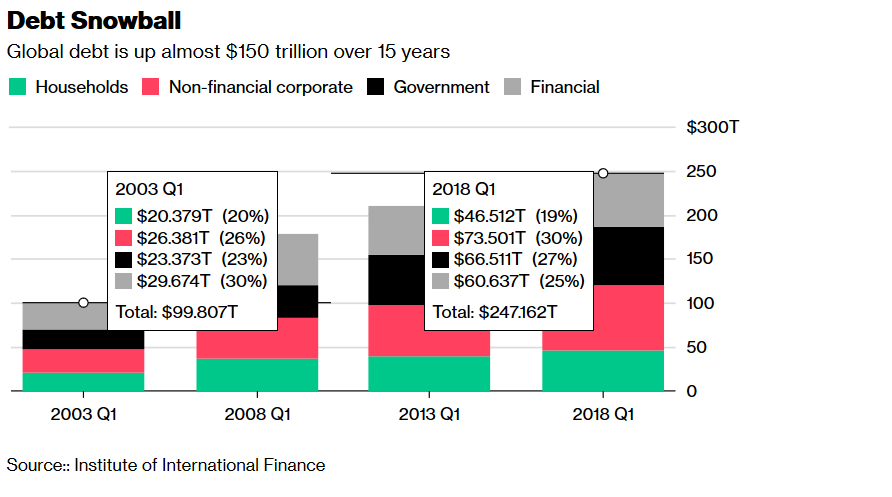
Per the IIF, since 2003 total global debt— the amount owed collectively by
- Households (people like you and me)
- Corporations (Like Apple and P&G)
- Governments (National debt of the U.S. Treasury, Bank of Japan)
- Financial (banks, non-banks and other financial institutions)
— to investors, bond holders, etc., increased by staggering amounts. Here are the numbers for each year shown:
- 2003: $99.8 trillion
- 2008: $177.8 trillion
- 2013: $209.4 trillion
- 2018: $247.2 trillion
Let’s put these debt numbers in context. Our U.S. annual GDP, as you know, is about $20.7 trillion annually. Annual global GDP is about $80 trillion in total. Said another way, today’s global debt is about three (3) times global GDP. Say what you will, that’s a lot of debt.
Alternatively, that’s a lot of assets, too. In other words, someone owns all that debt. Lenders are owed all that debt. Every debt has a corresponding asset against which the debt is lent — whether that asset is liquid or illiquid. You’ll remember from last week’s SHI Blog, right now American households have a net worth of about $109 trillion. Much of that is net worth is debt owed to households by governments, corporations, etc. So while there is a sea of debt out there right now, there is also an ocean of corresponding assets.
You may recall the FEDs balance sheet peaked at around $4.5 trillion in total assets. Well, at last count, they had reduced that balance to about $4.1 trillion. So, in about 2 years, they have permitted about $400 billion to ‘roll-off’ the balance sheet … simply by not reinvesting the proceeds they receive when Treasuries or MBS (mortgage backed securities) they own pay off. In 2019, they anticipate rolling-off another $600 billion…reducing their assets to about $3.5 trillion. Which, according to my calculations is about where they will stop .. or at the minimum, slow dramatically. Much of the rate fear impacting our bond markets has been the size of this roll-off. The fear has been the sheer magnitude of the roll-off, amid concern the size will overwhelm the debt markets. But this fear, too, is overdone. If the FED reduced their balance sheet by $600 billion against the global debt levels of 2003, they would be (effectively) “reselling” 0.6% of total global debt into the market. But with 2018 debt levels at $247 trillion, the injection is only 0.24% of the total. As with most numbers, it’s important to keep this one in context.
The FED meeting is over … and the FED has spoken: Short term rates were increased by 0.25% to a current FED funds maximum of 2.5%. This is the 4th rate hike this year. But the FED softened their stance today. They are now forecasting only two (2) rate hikes in 2019 — down from an earlier forecast of 3. And they have lowered their expectation for the ‘neutral’ interest rate down to 2.8%. And … Powell has assured us he and the FED are now more ‘data dependent’ than in 2018. Powell assures us that he and his colleagues will be “watching closely.”
Good. I’m pleased with these comments. My concerns over a FED-triggered recession are reduced. Now, let’s jump over to the steakhouses and see if the market turbulence has impacted pricey steak house reservation demand. Here’s our longer term trend SHI10 data:
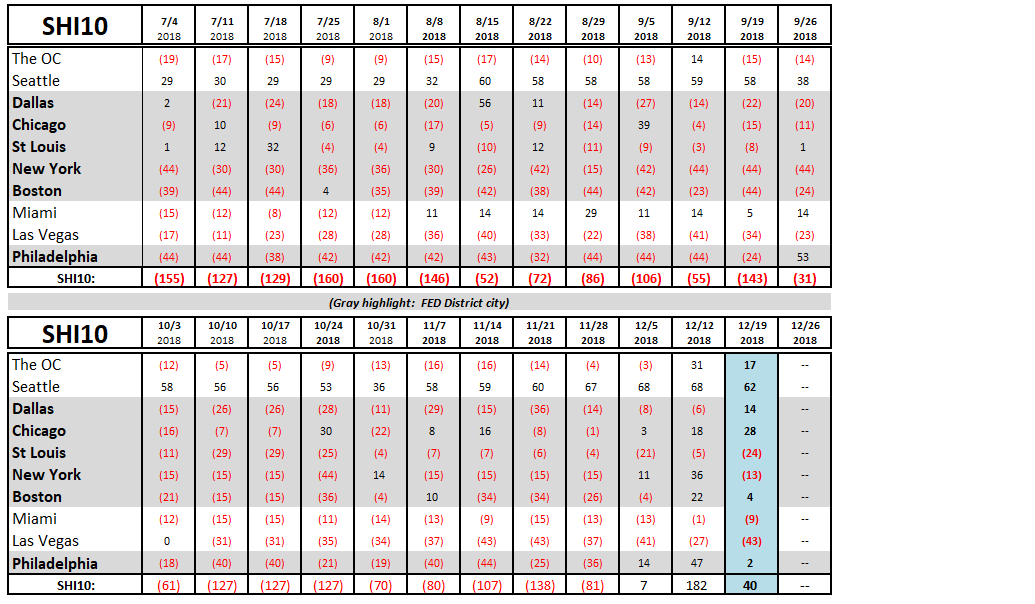
Well, the data is a bit mixed. During this week in 2016, reservation demand was exceedingly robust. But in 2017, we saw a similar dip in demand. But I think the stock and bond market performance has impacted reservation demand. With Dallas and Chicago the only steakhouse marketplaces that experienced increased demand this week, and the ‘coastal’ financial centers like the OC and NYC experiencing softness, I feel we can attribute some of this to market conditions.
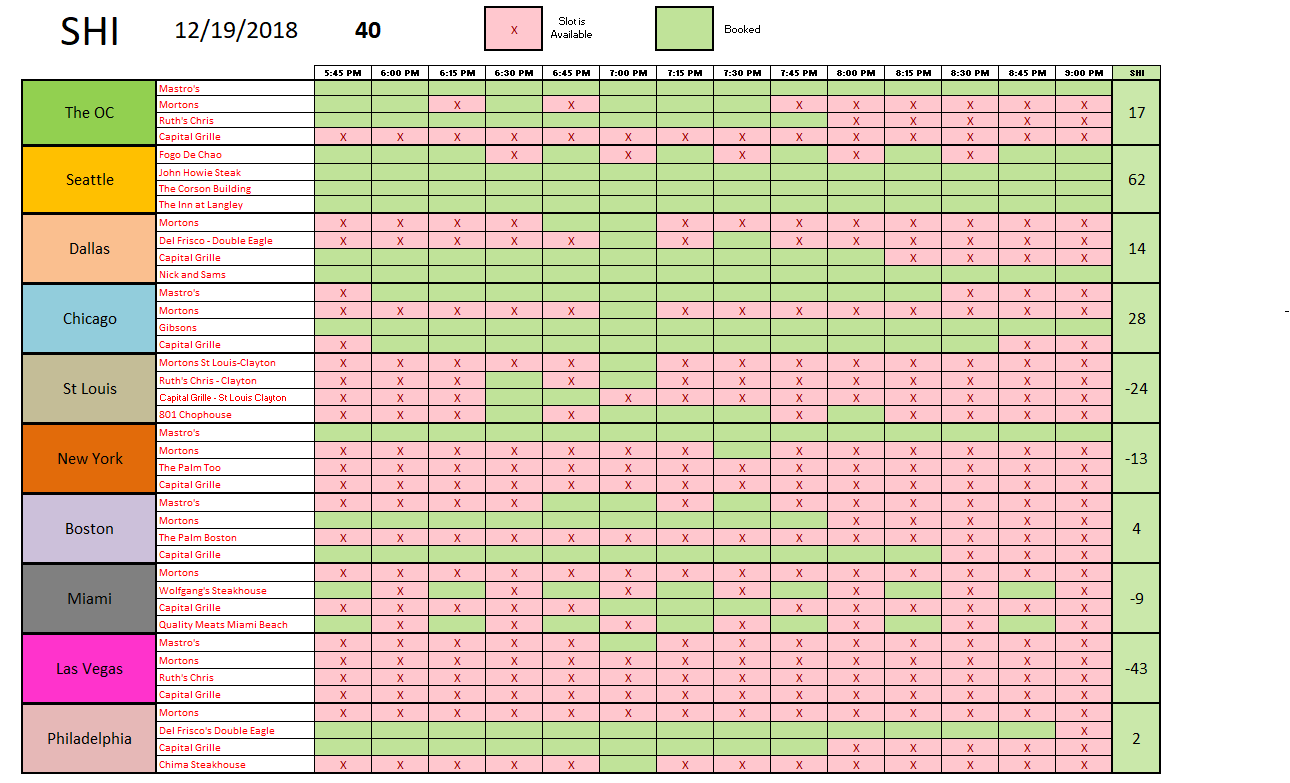
Here is the weekly SHI10:
Finally, one more comment on debt … since we’re talking about debt.
China owns more U.S. Treasuries than any other foreign country. In light of the trade dispute, have you been worried about China “dumping” their Treasury holdings, causing Treasury values to plummet … and destabilize the U.S. economy? Triggering another Great Depression? It’s a common fear … and one I hear often from SHI readers.
While I can’t put your mind at ease, consider this:
- As of October, 2018, China owned Treasuries totaling $1.1389 trillion. In October, 2017, the number was $1.1892 — about $50 billion more. In other words, China’s holdings of U.S. Treasures have declined by more than $50 billion over the past year.
- At the same time, in of October, 2018, U.S. Treasury “debt held by the public” equaled $15.843 trillion. One year prior, in October, 2017, the number was $14.751 — about $1,092 billion less. Said another way, today China holds 7.19% of U.S. debt “held by the public” … and one year ago, the number was 8.06% — almost a full percentage point more.
The bottom line? China could still cause a stink in the debt markets if they chose to. But their power to do so is diminishing over time.
Are you curious about who owns U.S. Treasuries … and how much? Take a look:
http://ticdata.treasury.gov/Publish/mfh.txt
Permit me to close with a few non-economic, non-financial comments. On behalf of all of us here at the SteakHouse Index, we wish you a very happy holiday season — whatever your beliefs — and a Happy New Year. It continues to be a pleasure for me to share my rantings and meanderings…and I’m pleased you feel compelled, for whatever reason, to read them.
This will be my last post until next year. The entire SHI staff is taking off until we see you again on January 2nd. Until then, enjoy your family and friends and forget about money! Unless you need more antidepressants. 🙂
- Terry Liebman


1 Comment
Hard to believe that everyone at the SHI gets a vacation at the same time. What has the world come to??