
SHI 12.28.22 — The Year That Was and Wasn’t

SHI 12.14.22 — The Law of Large Numbers
December 14, 2022
SHI 1.5.23 — Jobs, Jobs, Jobs. And Money.
January 4, 2023
2022 is almost over.
And what a year it’s been … highlights and ‘lowlights’ include:
According to the Center for Economics and Business Research (“Cebr”), a London-based economic consultancy, 2022 was a great year for the global economy. According to the Cebr, “world GDP (measured) in USD rose above $100 trillion for the first time ever.”
According to Bloomberg News and Goldman Sachs, 2022 was the worst year ever for bonds. Investment grade corporate bonds should finish 2022 at a “minus 14%” according to researchers at GS, “a level that is nearly 3X the prior greatest-decline on record since 1974.”
And according to Statista, a global statistical economist group headquartered in Hamburg, Germany, by the end of 2022, the global container ‘freight rate’ will be almost identical to the pre-pandemic cost. In that respect, 2022 simply facilitated a round-trip in cost:
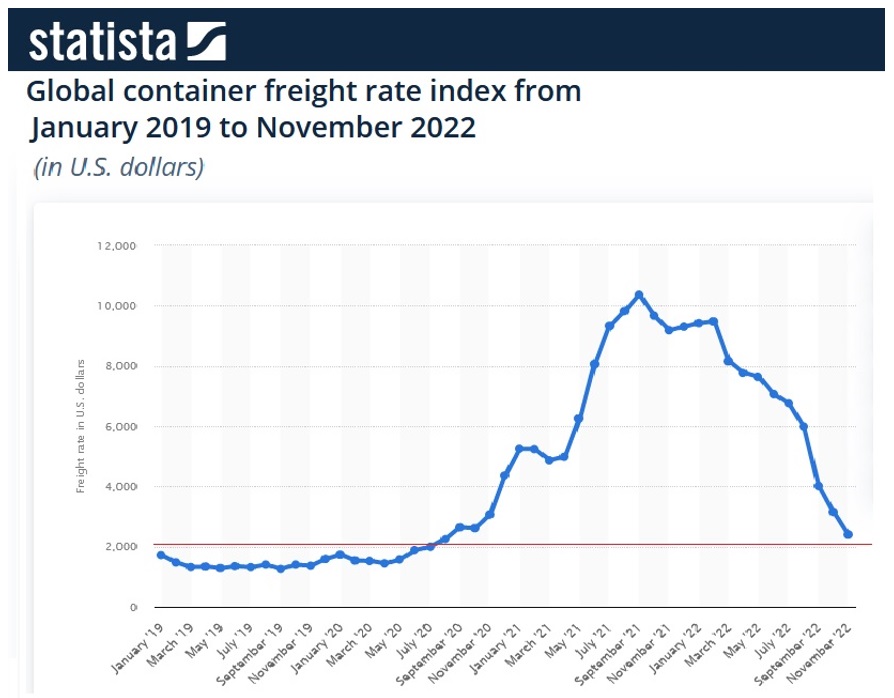
In 2022, we scaled new peaks, hit new depths, and often remained the same. Thru that lens, 2022 might be considered sedate or tame. It wasn’t. Even when compared to 2020 and 2021, others believe it was a year deserving superlatives.
“
2022. What a year.”
“
2022. What a year.”
Like every year, 2022 was unique … another special-snowflake-of-a-year.
But to me, far more surprising than the unexpected twists and turns was the fact that so many economic “experts’ were simply wrong. Flat out wrong. Over and over again. Conditions and events experts assured us “are” turned out they are not. What “was,” as it turned out, wasn’t. Confused? I don’t blame you … but keep going! 🙂
Welcome to this week’s Steak House Index update.
If you are new to my blog, or you need a refresher on the SHI10, or its objective and methodology, I suggest you open and read the original BLOG: https://www.steakhouseindex.com/move-over-big-mac-index-here-comes-the-steak-house-index/
Why You Should Care: The US economy and US dollar are the bedrock of the world’s economy.
But is the US economy expanding or contracting?
Expanding. At the end of Q3, 2022, in ‘current-dollar’ terms, US annual economic output rose to $25.74 trillion. Thru Q3, America’s current-dollar GDP has increased at an annualized rate exceeding 7%. The world’s annual GDP rose to over $100 trillion during 2022. America’s GDP remains around 25% of all global GDP. Collectively, the US, the euro zone, and China still generate about 70% of the global economic output. These are the 3 big, global players.
The objective of this blog is singular.
It attempts to predict the direction of our GDP ahead of official economic releases. Historically, ‘personal consumption expenditures,’ or PCE, has been the largest component of US GDP growth — typically about 2/3 of all GDP growth. In fact, the majority of all GDP increases (or declines) usually results from (increases or decreases in) consumer spending. Consumer spending is clearly a critical financial metric. In all likelihood, the most important financial metric. The Steak House Index focuses right here … on the “consumer spending” metric. I intend the SHI10 is to be predictive, anticipating where the economy is going – not where it’s been.
Taking action: Keep up with this weekly BLOG update. Not only will we cover the SHI and SHI10, but we’ll explore “fun” items of economic importance. Hopefully you find the discussion fun, too.
If the SHI10 index moves appreciably -– either showing massive improvement or significant declines –- indicating growing economic strength or a potential recession, we’ll discuss possible actions at that time.
The Blog:
We’re #1!
According to the Cebr, the United States economy still ranks #1 globally. And they expect us to remain firmly in the #1 slot … until 2037 … when they forecast China’s GDP will surpass the US – and India will be in a solid #3 position. Right or wrong, their forecast is easy to understand and follow below:
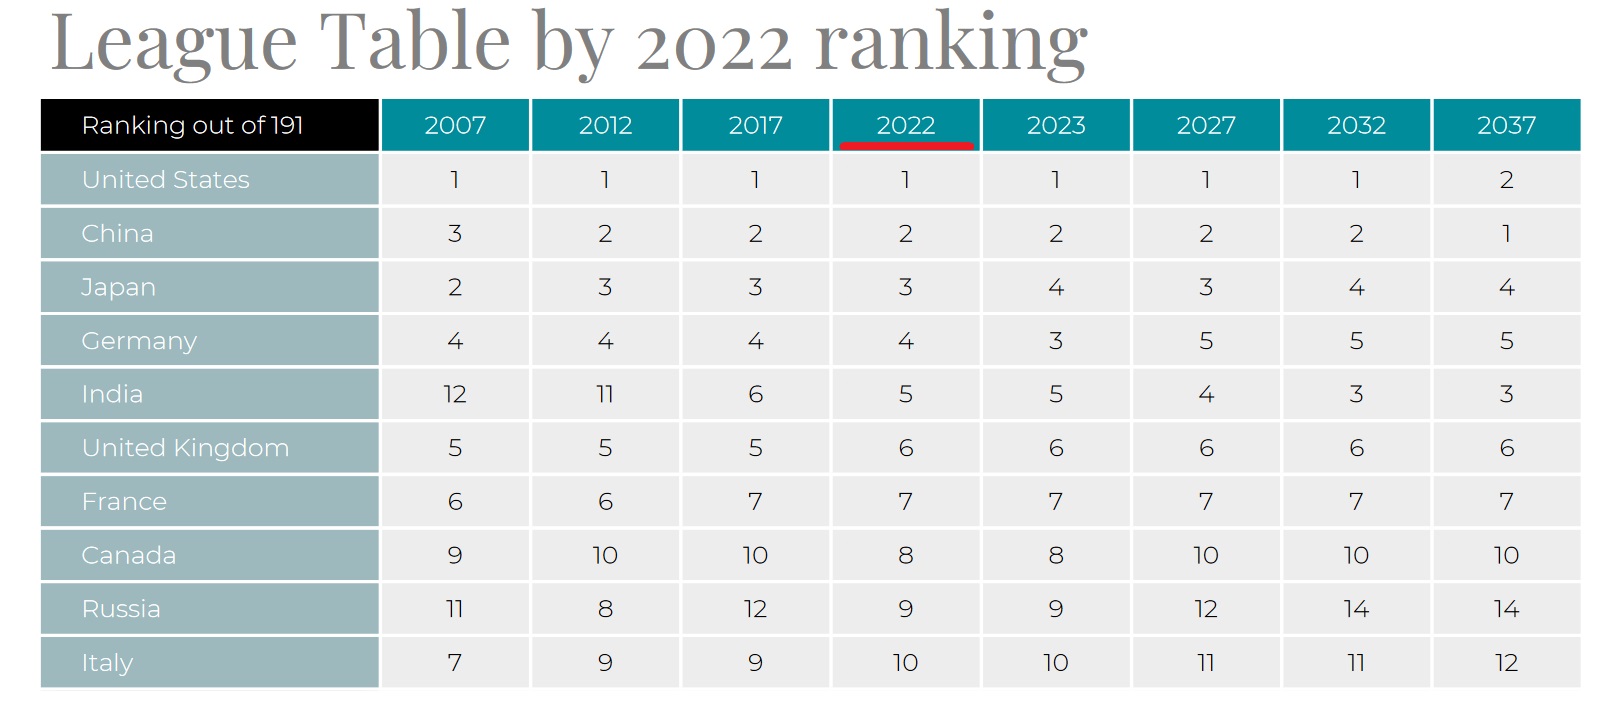
Look at the “2022” column. Yes, that’s just the top 10. And yes, this list measures each country’s GDP in US dollars. If you want to see the entire list, open this link (right click, open a new tab) and go to page 23 where the list begins.
https://cebr.com/wp-content/uploads/2022/12/WELT-2023.pdf
Perhaps the wildest ride of all has been the per-barrel oil price during the past couple years. Do you remember when the price went negative?
On April 20th, 2020, the WTI price became a Covid casualty. It went negative in a first ever event, momentarily falling to a negative $37.63 per barrel. It quickly recovered. In March of 2022, the per-barrel price peaked at over $123 – thanks to the Russian invasion of Ukraine. Here’s a great image courtesy of Cebr:
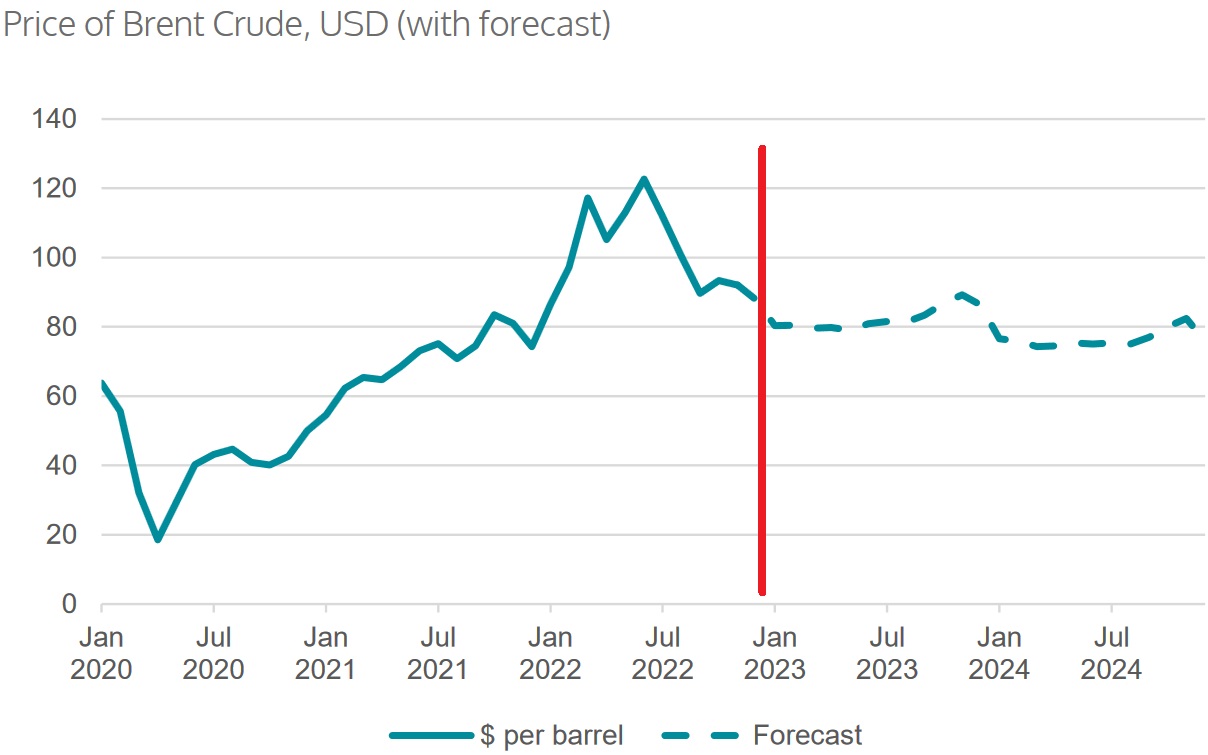
I added the red line … separating history from forecast. For months, experts predicted the price of oil would rise much higher. It did not. While the ‘post-covid’ barrel price is not identical to the January 2020 number, it is far closer than any other time post-Covid, and post-Ukrainian invasion. Almost a ‘round-trip.’
You may recall that commodity prices skyrocketed at the end of Q1, 2022 … another Ukrainian war casualty, as I discussed in depth on 3/30/22:
https://steakhouseindex.com/shi-3-30-22-q1-ends-with-a-bang/
Perhaps I should have named that blog, ‘Things Change.’ Because they always do. And that fact is nowhere more apparent that in the charts for the commodities ‘wheat’ and ‘corn’:
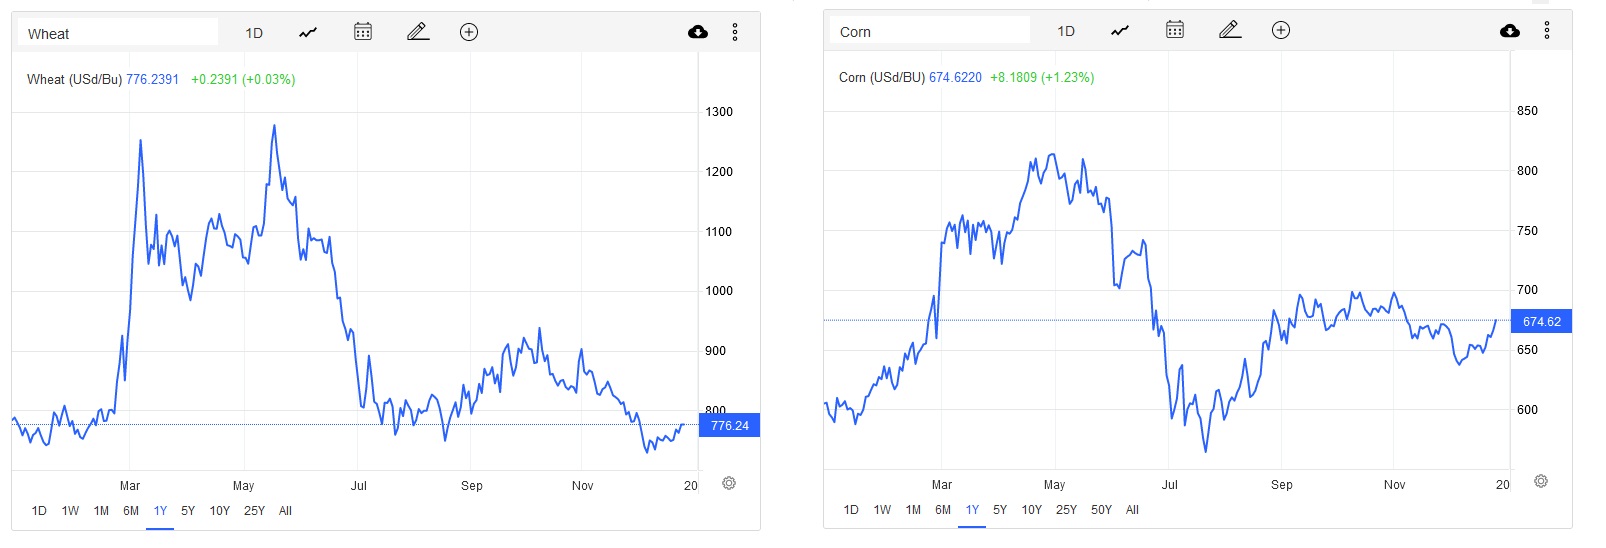
Post-Russian invasion, wheat prices skyrocketed. I underestimated the world’s ability to adapt to this challenge … but they did, and wheat prices today are almost identical to January, 2022. The corn price remains a bit elevated, but it, too, is almost back to early January prices.
It’s worth noting that Goldman Sachs disagrees … and feels we’re in the early days of the next commodities super-cycle. They have a bunch of smart guys over there … so it’s worth reading their thoughts (right click, open a new tab):
Are home values falling? I think the short answer is “it depends.” Here in the US, ‘location’ is once again critically important. Certainly ‘list’ prices are off their peaks — that ‘froth’ is gone. And, yes, it does appear some homes are selling for less than similar homes just a few months ago. But year over year, prices remain higher. The S&P ‘Case Shiller US National HPI’ is still up significantly for 2022. January’s index reading was 274 … today, it is 299 – 9% higher.
We all saw the semiconductor ‘chip shortage’ earlier in the year …. Now we have a chip glut. Things change, it appears, and often revert to prior levels. Who knew? 🙂
Of course, some post-Covid conditions seem exceptionally sticky – and what “is” appears to be right. People remain missing from the labor force. Deglobalization, nationalism and ‘economic pugnaciousness’ are picking up steam … and will likely become the new normal.
https://steakhouseindex.com/shi-3-16-22-it-will-be-tough-from-here/
Europe is struggling … and I fear 2023 will be very challenging over there.
Counting The Numbers
Let’s take a deeper dive into some interesting numbers.
1
Forbes magazine assures us 2022 was the worst year ever for bonds. Using the ‘Bloomberg US Aggregate Index’ as their source, since 1977 bonds have fallen in value only 5 times. Previously, the most significant decline was 2.9% in 1994. Thru the end of November, the Aggregate was down nearly 13%.
2
Only two major central banks — the Bank of Japan and the People’s Bank of China — chose not to raise interest rates this year. For context, remember the Bank for International Settlements, the BIS for short, has 63 members. Central banks have collectively increased rates by more than 70 percent in 2022, according to LPL Financial. “Follow the FED” seemed to be the mantra.
44 billion
The value in dollars of Elon Musk’s Twitter deal. Most was paid in cash – well, cash from the sale of Tesla stock – the debt balance of $12.5 billion came from a number of investment banks, led by Morgan Stanley.
889 billion
Is the ‘market cap’ value decline for Tesla during 2022. Poor Tesla. On January 3rd, 2022, Tesla boasted a ‘market cap’ of $1.239 trillion. Today, that number has shriveled to only $350 billion-ish. Ouch. Poor Elan no longer holds the title “the richest man in the world.” No doubt, Tesla is an amazing car and ‘tech’ company – Elon’s genius is as apparent as his folly – but once again we bear witness to a modern-day Icarus who flew too close to the sun, eventually falling back to earth. Yes, there’s much more to Tesla’s fall from grace than that … but that’s a good enough take-away for today.
4.5 trillion
Including Tesla, this year the “big tech” stocks lost over $4.5 trillion in market cap. This is lumping together value losses in Amazon, Apple, Alphabet, Microsoft, Tesla and Meta, during 2022. A staggering sum … but for context, keep in mind the “value of global domestic equity” markets – according to Statista – was about $105 trillion in mid-year 2022. That number, too, is down quite a bit from EOY 2021, when the total was almost $122 trillion.
900 billion
After eclipsing a $3 trillion collective market cap, crypto assets also fell back to earth. Today, the aggregate value of all cryptocurrencies is less than $900 billion. I’m guessing the members of the Bored Ape Yacht Club are no longer bored.
151,000
Layoffs in the “tech sector” according to Layoffs.fyi. Given the number above, are you surprised the number isn’t higher? I am, considering the number of folks employed in the “information” sector, according to the Bureau of Labor Statistics, was almost 3.1 million in November of 2022. In the total tech sector, the number employed is estimated to be between 6 million and 12 million.
4,000
The daily number of “new Covid cases” in the entire country of China, on Friday before Christmas. According to “official” figures from the central government. Remember that China is the home to about 1.4 billion people.
The New York Times does not believe official figures. On Christmas Day, they reported “a picture is emerging of the virus spreading like wildfire.” They reported:
At a news conference on Sunday, an official in Zhejiang Province, home to 65 million people, estimated that daily Covid cases there had exceeded one million.
In the eastern city of Qingdao, population 10 million, a health minister said on Friday that there were roughly half a million new cases each day, a number he expected would rise sharply in the coming days, local news sites reported.
In Dongguan, a city of seven million in central Guangdong Province, a city health commission report on Friday estimated between 250,000 and 300,000 new cases daily.
And in northwestern Shaanxi Province, officials in Yulin, a city of roughly 3.6 million people, logged 157,000 infected on Friday, with models estimating that more than a third of the city’s population had already been infected, according to local media.
Could these numbers also be inaccurate — on the up side? Sure. But consider this news just in from Italy: 38% of the passengers on a recent flight from China to Milan tested positive for Covid, according to Italian health officials. On a second flight, 52% tested positive.
Last week, the London Financial Times reported that an ‘internal estimate’ suggests 250 million people caught Covid during the first 20 days of December. Regardless of who’s right, 4,000 cases a day is clearly a wildly inaccurate, vast under-reporting by China’s central government.
I know! Inaccurate China statistics? That never happens! HA HA HA HA. 🙂
90 million
The number of “vacant” homes in China. Assuming a Chinese household-size of 2.5, China needs about 560 million homes. By this metric, 16% are vacant. Residential real estate development contributed about 25% to China’s GDP during the past 10 or so years. In 2022, the percentage was far lower, most likely in the single digits, but accurate numbers are hard to find. Regardless, lingering challenges will continue in China, given the social unrest and excessive debt balances still facing the housing industry.
2.89 trillion
Almost all year long, experts assured us that US corporate profits would fall precipitously. Yes, profitability on an annualized rate was down in Q3 – but only down from the highest-ever number in Q2. In Q2 of 2022, corporate profits eclipsed $3.043 trillion, on an annual basis, for the first time. Again, for context compare this number to Q2 of 2020 – a paltry $1.822 trillion. Said another way, on an annualized run-rate, corporate profits in Q3, 2020, were more than $1 trillion above the same calendar quarter 2 years ago. What? You don’t like that comparison, as we just entered the pandemic? Well the number was just slightly over $2 trillion in Q2 of 2019. Corporate profits are way up during 2022. And I expect they will rise further in 2023.
747
Boeing produced its final 747 jumbo jet on December 6th. I’m gonna miss that plane. 🙂
OK … Let’s take a break … and see how the steak houses are faring this week.
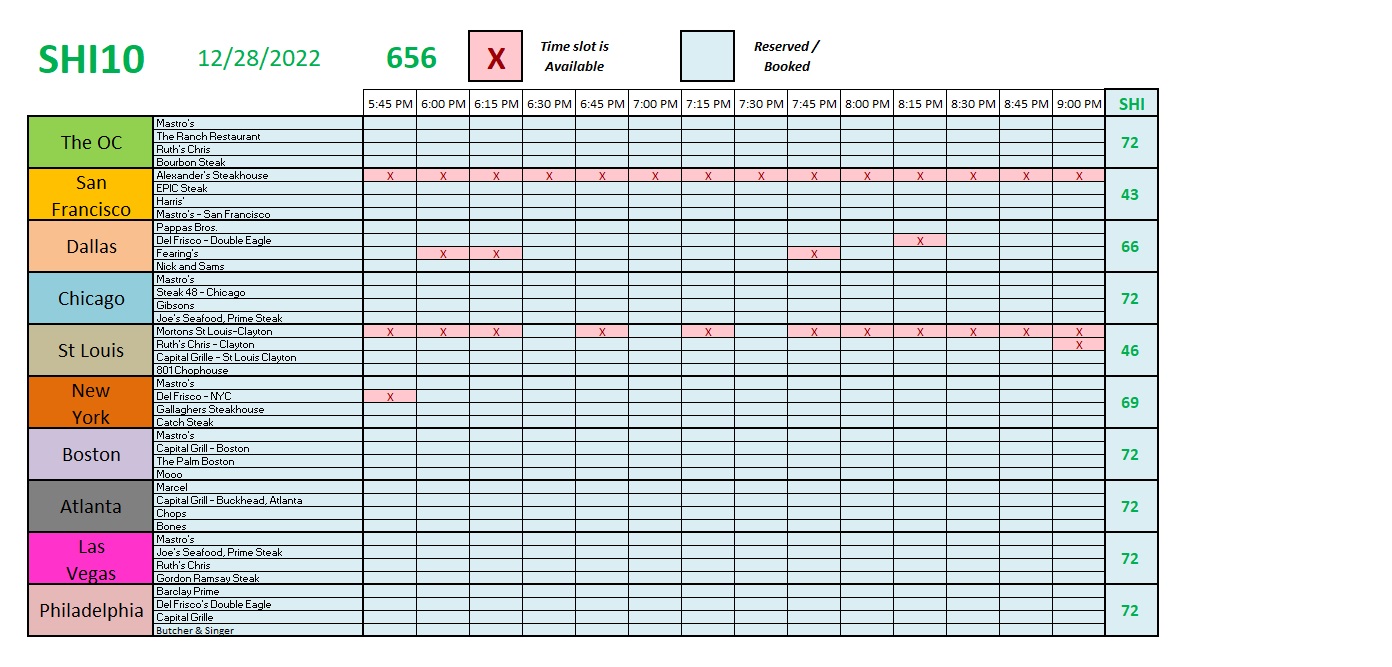
Fabulous is the short answer! That’s right: 5 of the 10 SHI cities are fully booked this coming Saturday! Right, of course, it is New Year’s Eve … so perhaps this outcome isn’t too surprising. 🙂
Here’s the trend report.
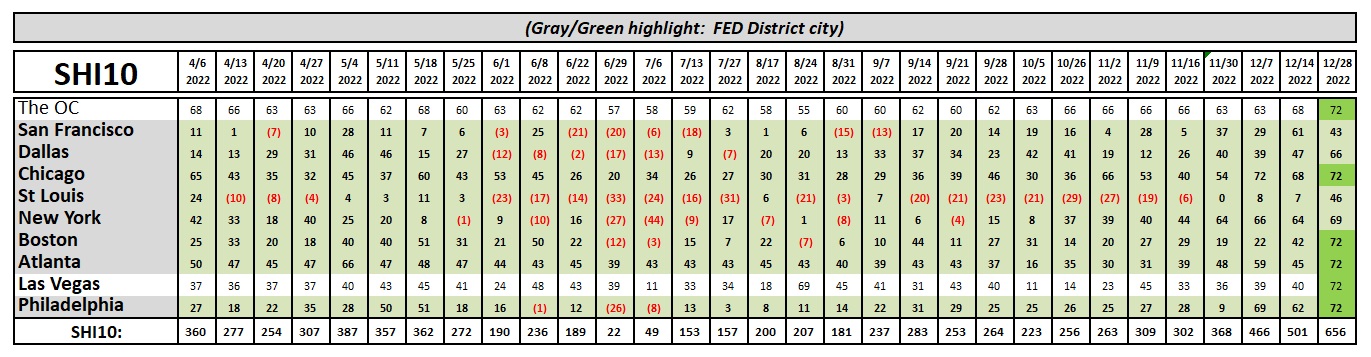
I’ve used a green hightlight on the fully-booked cities. Once again, consumers are voting with their wallets and seem to be saying: “Recession? What recession?”
Some Other 2022 Thoughts
Consider this quote from the December 26, 2022 Cebr report:
“We expect world GDP will continue to recover. We estimate that it will amount to $102 trillion for 2022 as a whole and will roughly double to $206 trillion in 2037.”
Said another way, Cebr believes that world GDP will double in the next 15 years. Like all predictions, this one may or may not come to pass. But apparently global economic growth is chugging along.
Finally, if the staggering stock-price declines in Amazon, Microsoft and Google have convinced you the best days for these companies are behind them, think again. In the 12-month period ending Q3, 2022, ‘cloud infrastructure service’ fees totaled $217 billion. How much of that revenue is annually recurring? Most. How much of this ‘market’ do these 3 companies own? Almost 2/3s. These companies and the US dominate this still-growing, huge market.
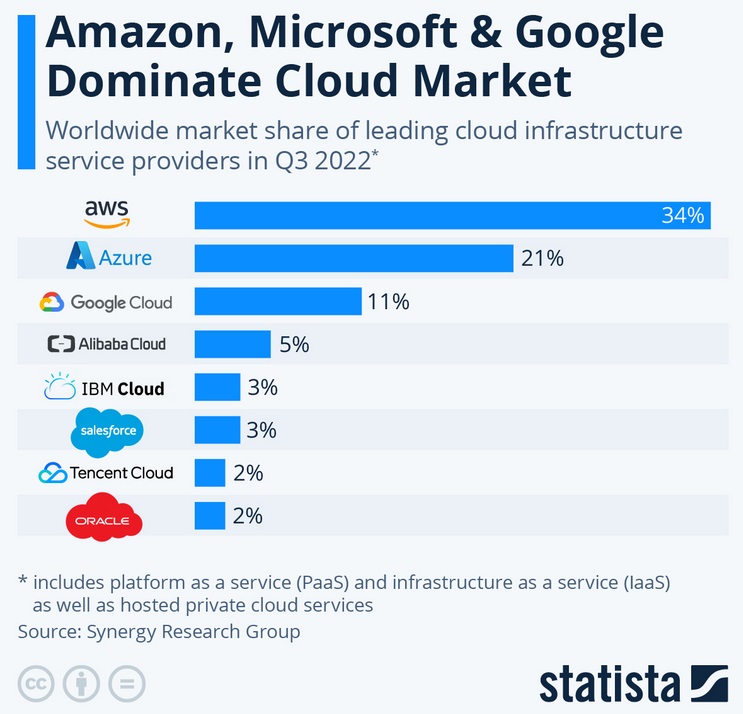
Ironically, it was Q3 of 2022 when Amazon’s AWS revenue growth ‘slowed’ to ‘only’ 27.5% Y-O-Y – 16% of Amazon’s total revenue. But far and away, AWS is Amazon’s most profitable business segment, contributing more than 55% of total profit. Like annual software license revenue, cloud revenue is recurring each and every year, making Microsoft a juggernaut with a predictable, sustainable, Y-O-Y revenue stream. Unlike Ford, they don’t need to sell additional more cars next year to be profitable.
Economically speaking, Inflation was probably the most talked-about topic in 2022. I’d venture a guess that the word ‘inflation’ was uttered even more often than ‘Sam Bankman Fried’! ?
Maybe. Will inflation continue to hog the headlines in 2023? Probably. However, according to Goldman Sachs, “The supply chain recovery and the deflationary impulse in the goods sector that it promised to bring, took much longer than expected but has finally arrived. [We] expect this ongoing process to push core goods inflation negative next year, driving most of the decline in overall core inflation.” Interesting.
My advice for you in 2023? Form your own opinions. Don’t believe everything you hear … or read. If something seems ‘off,’ dive into the massive on-line data pools from reliable, objective sources. Then make up your own mind.
The experts expect a recession in 2023. Meaning, they expect two (2) consecutive quarters of negative GDP growth.
I disagree. The US consumer is too strong. Ignoring the FED for the moment, in 2023 I expect significant reductions in M-O-M inflation growth, and moderate, consistent GDP growth.
Am I right? Who knows? I’ll get back you in 12 months. ?
Happy New Year!
<:> Terry Liebman


