
SHI 4.22.20 – Bailouts

SHI 4.15.20 – FOMO and LOCO in the Great Lockdown
April 15, 2020
SHI 4.29.20 – What’s Wrong with This Picture?
April 29, 2020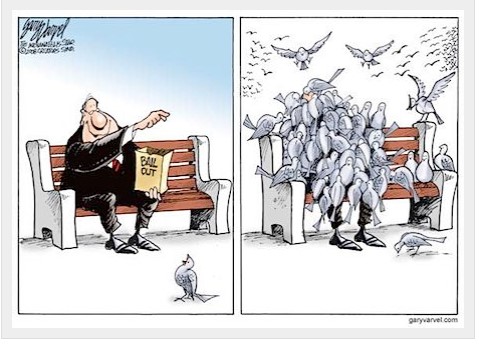
“Should governments bailout businesses shuttered by of the Great Lockdown?”
Great question, right? Of course, there is no right answer. Because any answer you or I might offer up is merely an opinion. Our own opinion. Not a statement of fact. So, feel free to opine away … as I will below. 🙂
Welcome to this week’s Steak House Index update.
If you are new to my blog, or you need a refresher on the SHI10, or its objective and methodology, I suggest you open and read the original BLOG: https://www.steakhouseindex.com/move-over-big-mac-index-here-comes-the-steak-house-index/
Why You Should Care: The US economy and US dollar are the bedrock of the world’s economy.
But is the US economy expanding or contracting?
Before COVID-19, the world’s annual GDP was about $85 trillion today. No longer. It has shrunk sizable during ‘The Great Lockdown.’ I did not coin this phrase — the IMF did. The same folks who track global GDP. Until recently, annual US GDP exceeded $21.7 trillion. Together, the U.S., the EU and China still generate about 70% of the global economic output.
The objective of this blog is singular.
It attempts to predict the direction of our GDP ahead of official economic releases. Historically, ‘personal consumption expenditures,’ or PCE, has been the largest component of US GDP growth — typically about 2/3 of all GDP growth. In fact, the majority of all GDP increases (or declines) usually results from (increases or decreases in) consumer spending. Consumer spending is clearly a critical financial metric. In all likelihood, the most important financial metric. The Steak House Index focuses right here … on the “consumer spending” metric. I intend the SHI10 is to be predictive, anticipating where the economy is going – not where it’s been.
Taking action: Keep up with this weekly BLOG update. Not only will we cover the SHI and SHI10, but we’ll explore related items of economic importance.
If the SHI10 index moves appreciably -– either showing massive improvement or significant declines –- indicating growing economic strength or a potential recession, we’ll discuss possible actions at that time.
The BLOG:
In a word, yes. I do. I believe that because governments mandated the Great Lockdown in order to contain the human tragedy, they should also make a reasonable effort to limit the resulting business tragedy. Note that I used the word “reasonable.” I feel governments should make a “reasonable effort.” Ahhh … another subjective. How do we define reasonable? Once again, we’re back in the opinion category. Here’s mine.
The American Worker: It’s hard to determine precisely how many US employees have lost their jobs from the shutdown. The estimate today is about 22 million. This number is likely to grow. Here’s the good news for those folks: In addition to state unemployment benefits, each person will receive an additional $600 per week thru July 31 from the US government. I’m told the maximum weekly unemployment benefit in California is $450 per week…thus, an unemployed restaurant or hotel workers might qualify to receive up to $1,050 per week during this crisis. If the 22 million number is accurate, this additional unemployment benefit will cost the US Treasury $13.2 billion per week. This is a worthwhile use of taxpayer dollars.
American Small Businesses: What a mess. The first thing to become quite apparent is how interconnected all businesses are. Of course, we knew this … but now this fact is dreadfully obvious. Every small business is reliant on employees, suppliers and customers for its success. Remove any one of those components and the business has a huge problem. The Payroll Protection Program helped. Who got the money? Here are the facts from the SBA:
- 1,661,367 loans were made totaling $342,277,999,103
- 4,975 lenders made loans
- Lenders in Texas made the most loans: 134,737 totaling over $28.4 billion
- California came in 2nd with 112,967 loans funded and for a larger total: $33.4 billion
- 2 loans, totaling $419,582, were made in “AS.” Is that an abbreviation for American Samoa? 🙂
Need more data: Here is the SBAs “deck” summarizing the program results: https://www.sba.gov/sites/default/files/2020-04/PPP%20Deck%20copy.
Unfortunately, according to a survey conducted on the website covidloantracker.com, only about 7.8% of the PPP loan applicants actually received a PPP loan. I suspect this number is inaccurate, however. Why? Their survey respondents made 13,992 applications … who received 1,100 loans. That’s a very small number when compared to the total number of loans actually made. So what is the correct number? The data is sketchy at best. A study by the National Federation of Independent Business (NFIB) estimated that 70% of small businesses attempted to apply for a PPP loan, and 72% of those that tried successfully submitted an application. Multiplying that out means that half of small businesses (or about 15 million) successfully applied for a PPP loan. If 15 million applied, and 1.661 million loans were granted, the percentage of approved/applied is closer to 11%. Regardless, by any measure, most small businesses did not yet get PPP funding. A “second tranche” of PPP funding was approved yesterday by the Senate. This will help … but I suspect my “image” at the top of this blog accurately summarizes how it will go.
Assuming PPP loans totaling $300 billion equate to about 10% of ‘small business’ demand, should the American taxpayer shoulder the total program cost of $3 trillion? Sure, a large portion of this total is a loan … but much of the sum is likely to be forgiven. Tough question. Tough call. I don’t know.
Especially in light of all the other fiscal and monetary stimulus already offered up here in the US and around the world. Here’s a great chart from JP Morgan:
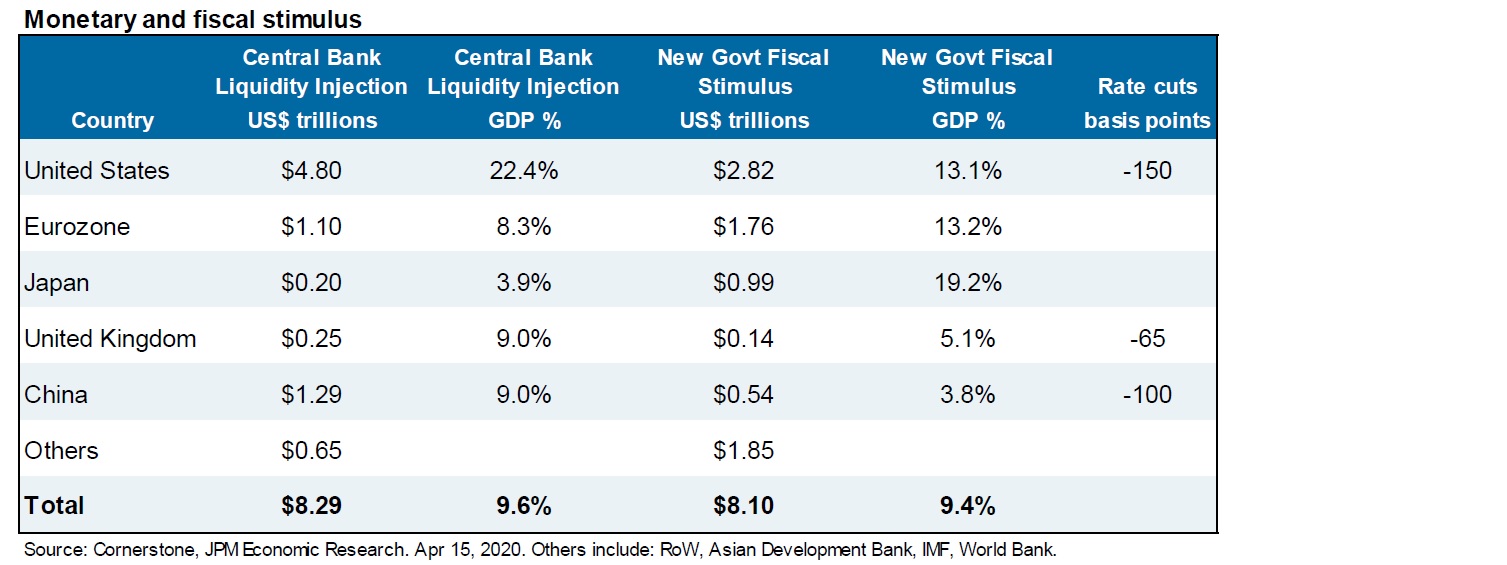
The numbers are staggering in size: Combined fiscal and monetary stimulus — around the globe thus far — equals $16.39 trillion. Staggering.
Again, remember, the vast majority of this amount are loans, or liquidity injections, that will not add to deficits. But many programs will add to deficits. As I’ve mentioned before, we’ll talk more about this after the dust settles. Now is not the time.
I suspect everyone watches developing pandemic news, every day, and so I won’t add to that pile. But here are two anecdotal data points I personally found quite interesting. Perhaps you will as well. Let me know.
First, a question: What impact might latitude and/or weather play on the spread of the pandemic? The graphic below is from a JP Morgan report. They asked the question, “What impact might latitude play in the spread of the virus?” The graph attempts to answer that question. Note that the ‘darker’ horizontal blue bars reflect the number of coronavirus cases at the latitude shown on the left, vertical axis. Geographic areas — cities, states, countries — appear beneath the horizontal blue bar, again, at the correct latitude. Take a look:
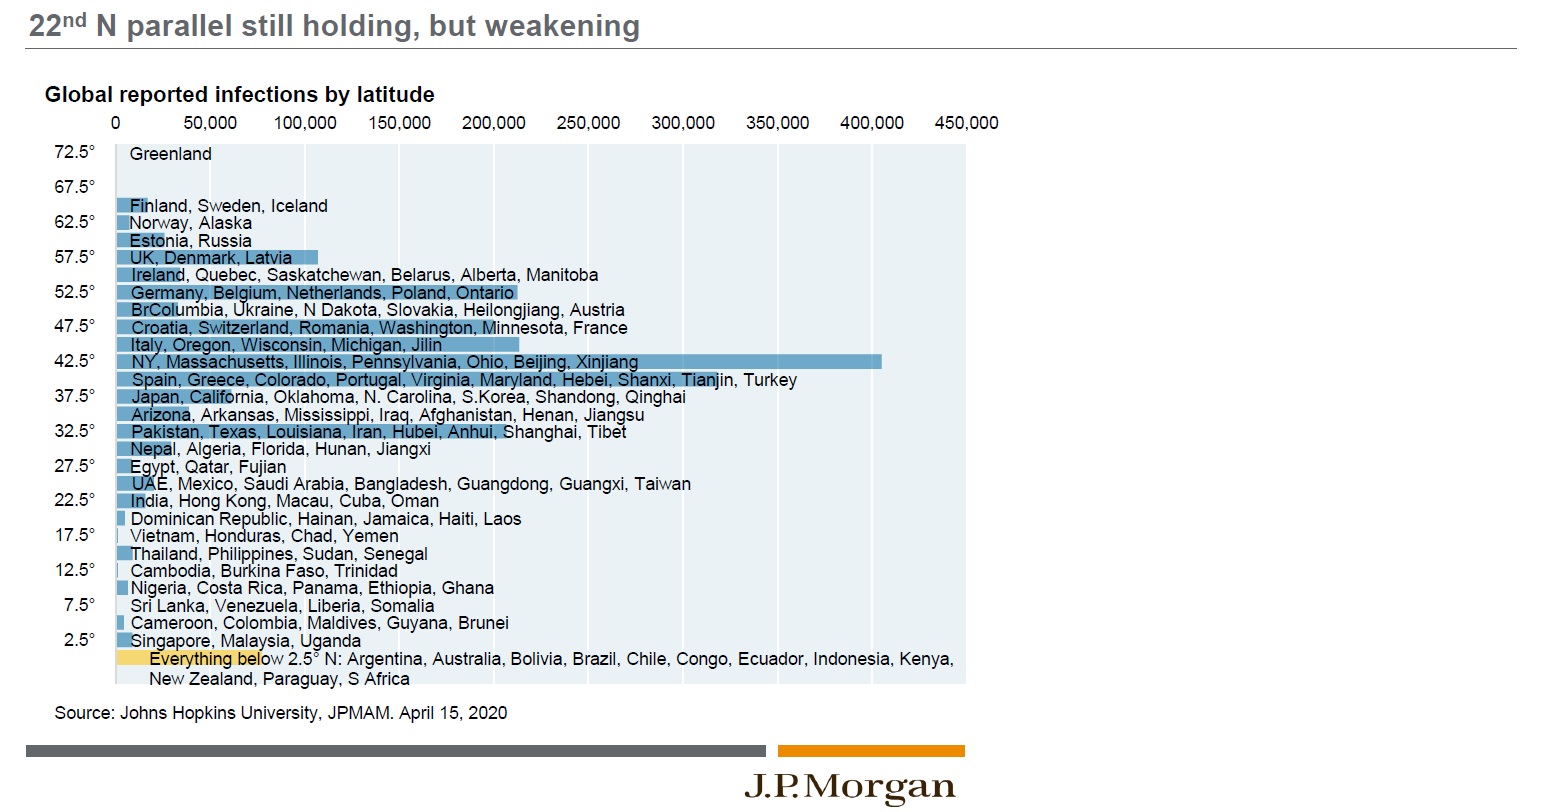
What might this graph tell us? Well, first, it’s easy to see there are very few infections below the 22nd parallel. The vast majority of COVID-19 infections are between the 32.5 and 52.5 degree parallels. JP Morgan summarizes this another way: 91% of infections have occurred in regions accounting for 59% of world population. Hmmm….. perhaps temperature and humidity do play a role in transmission. Time will tell.
Second, how widely spread has COVID-19 infection become? Per Johns Hopkins, US cases now equal about 835,000. But numerous studies are suggesting the disease may have been here much sooner than previously thought … and may have spread much further than currently believed. Consider one study, tangentially related to toilet paper. Yes, you heard me right. Toilet paper. 🙂
Biobot is a company in the business of analyzing sewage. They are presently analyzing ‘samples’ from over 100 sewage treatment facilities in 30 states. Yep. Samples. Fun. Anyway, a few weeks ago the Boston Herald posted an article based on MIT lab research conducted in junction with Biobot. Their comment:
“On March 25, the area represented by the sample had approximately 446 confirmed cases of Covid-19,” Biobot researchers wrote Wednesday in a post about their research. “Based on our sewage analysis, we estimate that up to 115,000 people are infected and shedding the SARS-CoV-2 virus.”
Well, that’s interesting. Not 446 cases … but 115,000 cases. More than 250X. Hmmm… Other studies around the US — usually driven by university science departments — are suggesting the same thing: The virus spread is far, far greater than the ‘confirmed’ numbers resulting from testing. Inasmuch as testing (thus far) has been reserved for those with actual symptoms, this anecdotal information suggests the vast majority of those actually infected may be completely asymptomatic.
Stay safe out there.
– Terry Liebman


1 Comment
Interesting. Based on Andrew Cuomo’s press conference today, and a new NY study he shared, he would agree with you on how widespread the infection is and when the spread began. All of which dramatically reduces the projected infection rate and shows that most with it have no symptoms. Worth shutting down the economy? Emphatically NO!