
SHI 5.25.22 – Economic Long COVID

SHI 5.18.22 – Reading The Tea Leaves
May 18, 2022
SHI 6.1.22 – More Whisper than JOLT
June 1, 2022
Prices are high today. Is anything cheaper today than a year ago?
It turns out the answer is yes. According to the most recent CPI report from the Bureau of Labor Statistics (“BLS”), ‘televisions’ are 5.8% less than they were a year ago, April. Smartphones are 16.1% cheaper! And while there are a few other “broad item categories” in the more than 200 listed that are marginally lower in price, the vast majority are up. By quite a bit. No single category has quite doubled in cost during the past year, but “fuel oil” has come close – the April 2022 price is 80.5% higher than in April of 2021. Of course, for many of these “finished goods” their raw-material cost is way up, too. Measured by the “Producer Price Index,” also tracked by the BLS, the cost of “stuff” required to make the things we eat, wear and live-in are also up quite a bit. Input costs are way, way up.
“
Input costs are up significantly.”
“Input costs are up significantly.”
Why you ask? I’ve shared my opinion about some of the root causes in past blogs. But essentially, we face an imbalance in the equilibrium between general supply and demand relationships. Demand far outstrips supply is so many areas today. But the answer is not just the demand spike. No, something deeper, far more systemic is unfolding right now. Across the globe, the pandemic triggered a massive fiscal stimulus response, lock downs, closed borders, onshoring, and a general realization that it may not be wise to rely simply on the promise of global economic prosperity to insure one country’s access to critically important food, medical, technological and other items. No, after nurturing a decades-long philosophy of “building a better global economy together”, many countries today plan to go it alone. And if not completely alone, with far fewer ties to other countries. You can blame the pandemic as the root cause, but irrespective of the cause, the effect is clear:
—-> A systemic erosion of generational trust between historic global trading partners; and,
—-> The destruction of decades-old, deeply embedded global supply chains.
“Peak globalization” is now in our rear-view mirror. Now, cost increases reflect the rough seas of global disruption; over time, cost increase will become more systemic as historic global relationships fall and economic nationalism rises. I fear both are inevitable COVID outcomes. We all know COVID has had a devastating impact on humanity. Perhaps less appreciated as of yet, I fear it has had a similar adverse impact on global economic activity and global GDP. And this outcome … this new condition … I fear will last for years, if not decades.
Welcome to the time of “economic LONG COVID.”
Globalization is not dead and gone, of course. It’s simply evolving. But much like COVID itself, because of COVID, globalization as we’ve known it has begun to mutate into new and previously unseen forms, shapes and relationships. And as this mutation continues, general cost levels will remain elevated, essentially occupying a new “price plateau.” Gone are the days of expanding world markets and lower prices of finished goods. I’m afraid we will never again see a toaster at Walmart priced below $10.
Many will likely view this general cost shift as an inflationary event. I don’t think that’s it. That idea doesn’t take in the full magnitude of the change. So while that viewpoint is not inaccurate … I feel a more accurate view is this: An economic earthquake struck the global economy. A massive quake. One so large, so dramatic, that the general price level abruptly shifted up significantly. That new price/cost level represents the “new normal” for prices and costs. On that plateau, inflationary pressures will wax and wane … but a traditional inflationary episode is not what caused the quantum shift in the first place. That was caused by the “COVID economic earthquake,” and then the Russian “aftershock.” Meet the new world.
Welcome to this week’s Steak House Index update.
If you are new to my blog, or you need a refresher on the SHI10, or its objective and methodology, I suggest you open and read the original BLOG: https://www.steakhouseindex.com/move-over-big-mac-index-here-comes-the-steak-house-index/
Why You Should Care: The US economy and US dollar are the bedrock of the world’s economy.
But is the US economy expanding or contracting?
Expanding. Significantly. By the end of Q1, 2022, in ‘current-dollar’ terms US annual economic output clocked in at $24.38 trillion. Yes, during Q1, the current-dollar GDP increased at the annualized rate of 6.5%. The world’s annual GDP rose to about $95 trillion at the end of 2021. America’s GDP remains around 25% of all global GDP. Collectively, the US, the euro zone, and China still generate about 70% of the global economic output. These are the big, global players.
The objective of this blog is singular.
It attempts to predict the direction of our GDP ahead of official economic releases. Historically, ‘personal consumption expenditures,’ or PCE, has been the largest component of US GDP growth — typically about 2/3 of all GDP growth. In fact, the majority of all GDP increases (or declines) usually results from (increases or decreases in) consumer spending. Consumer spending is clearly a critical financial metric. In all likelihood, the most important financial metric. The Steak House Index focuses right here … on the “consumer spending” metric. I intend the SHI10 is to be predictive, anticipating where the economy is going – not where it’s been.
Taking action: Keep up with this weekly BLOG update. Not only will we cover the SHI and SHI10, but we’ll explore “fun” items of economic importance. Hopefully you find the discussion fun, too.
If the SHI10 index moves appreciably -– either showing massive improvement or significant declines –- indicating growing economic strength or a potential recession, we’ll discuss possible actions at that time.
The Blog:
Economists have been known to say “The cure for high prices … is high prices.”
For validation, look no further than this quarter’s financial reports from the well-known retailer, Abercrombie & Fitch. Earlier this week, they reported a 27 cents per share loss when the “street” expected a 36-cent profit. They now expect a “net sales” decline in the “low-single-digits” from the prior year, while forecasting an operating margin impacted by “higher freight and raw material costs.” One take-away: Higher prices are likely adversely affecting sales volumes.
Consider this economic data on precisely that topic, courtesy of the BLS. The “Producer Price Index” – which measures raw material costs and similar items used in manufacturing – is much higher today. And while the input cost of “services” is up appreciably, the input cost for “goods” is up a whopping 16.3% YoY.
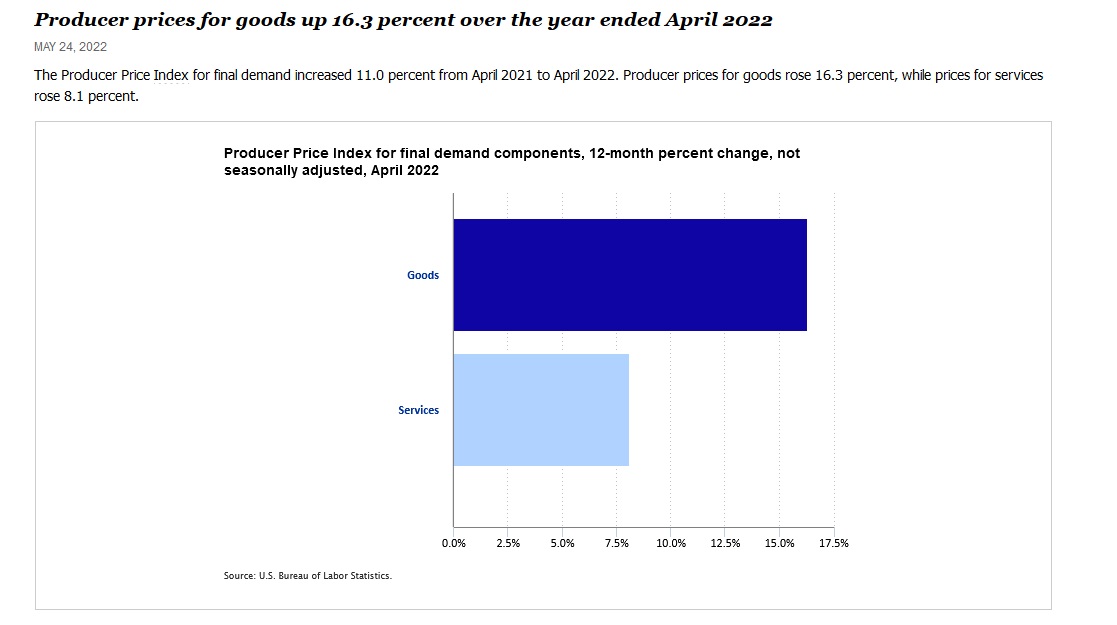
Sure, much of that is directly related to the “Foods” and “Energy” categories. But the third – for obvious reasons called the “Goods less foods and energy” is also up YoY by 10.1%. Within that group, the component “industrial chemicals” costs 22.5% more than just one year ago.
Frankly, I don’t know how restaurants are managing given the foods input-price increases. Consider this chart:
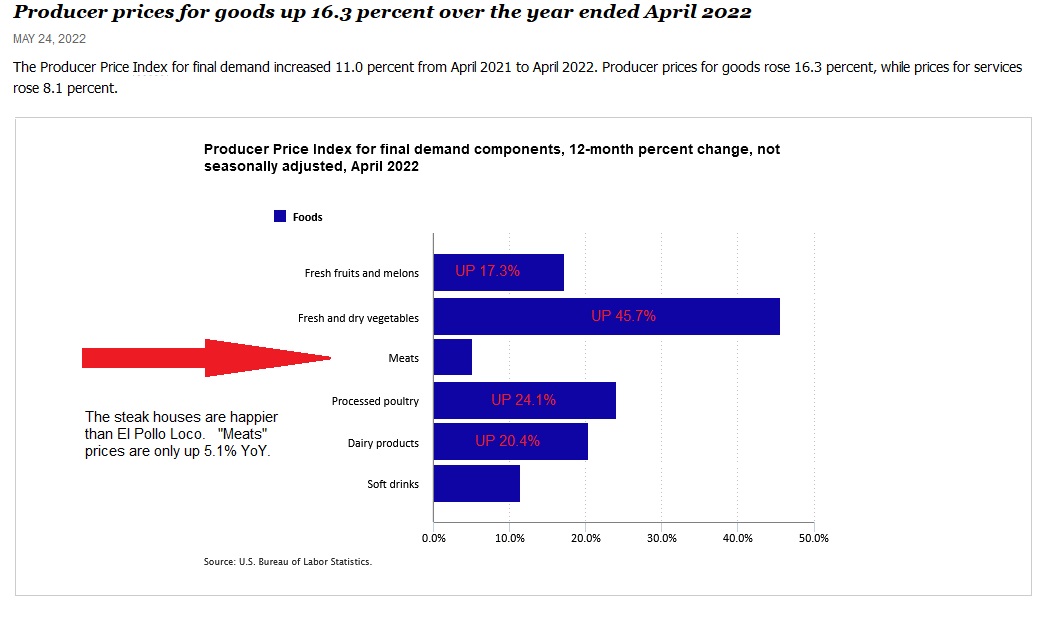
I thank my luck stars this is the Steak House Index blog and not the Chicken Coop Index blog, because while the price of “meats” YoY is up a bit over 5%, the cost of “processed poultry” is up a whopping 24.1% over this month last year. Imagine you own a ‘Kentucky Fried Chicken’ franchise … how do you manage thru this kind of raw-material cost increase? How about the cost increase for “fresh and dry vegetables?” Up almost 46% in just one year? Staggering.
Not convinced yet?
Well, then consider this latest data on new home sales. In the year from April 2021, in April of 2022, across the United States,
New home sales fell 26.9%.
That’s right. In April of 2021, the annualized sales rate for new homes was 809,000. In April, 2022, this number fell to 591,000. A decline of 26.9%. Raw material and other input costs have driven new home prices steadily higher. Combine this with the outsized and rapid home mortgage rate increase and you have prima facie evidence of “demand destruction.” Demand is down. Significantly.
While existing home sales have not fallen off the same cliff, they are down too. In fact, according to the National Association of Realtors (“NAR”), existing home sales – measured month-over-month on a percentage basis – have declined every month since August of 2021. That’s right. For nine months in a row, existing sales have declined from the previous month, anywhere between 1% and 6.7%. Compare these declines to the numbers for April thru June of 2021: Increases month-over-month of 34.2%, 45.5% and 23.3%, respectively. The trend in existing home sales is down.
The cure for high home prices – eventually – was simply the high price for the home and financing.
There is a price at which demand for any discretionary item will fall to zero. Let’s take this concept to the absurd: Imagine a world where a new Ford F-150 costs $4 million. Or a brand-new, 1,200 square foot “starter” home in Adelanto, California, $18 million. Both numbers are, of course, absurd measured in today’s dollars. In that imaginary world, few if any new cars or new homes would ever be sold. At those prices, it’s likely all current demand would be completely destroyed.
Thru that lens we understand demand for all discretionary items is somewhat elastic: There is an extremely high price where sales transactions will cease. Just as there is an extremely low price where demand will far outstrip supply – as we saw in 2021. As prices move up the spectrum, higher and higher, eventually sale activity will decline and then, if prices get too high, cease. This relationship is inverse, elastic, and very, very real.
Demand destruction for discretionary goods is already a reality across our economy. Last week, we saw it in the used car market. Today, we see it in the young-adult clothing and the new- and existing-home markets.
As input prices increase, manufacturers and companies struggle to make a profit. And without a profit for a long enough period of time, they will leave the business. Unless they’re a “tech” company or Bitcoin. Neither of those enterprises intend to make a profit. ?
Just kidding. Profit motive is the driving force behind capitalism. Look no further beyond Abercrombie’s stock price, down about 30% immediately after releasing their news of a quarterly loss. If that outcome repeats next quarter and the quarter following, their stock price will go lower still. And if this trend continued indefinitely, eventually they would likely be forced into bankruptcy. Of course, this is simply hypothetical. Because they know this … and they will do everything in their power to ensure the actual long-term outcome is the opposite. This is what manufacturers and corporations do. They figure it out. If they cannot pass the raw material cost increase to their buyer, they will figure out other ways to cut costs. And re-achieve profitability.
Speaking of profitability, let’s head over to the steakhouses.
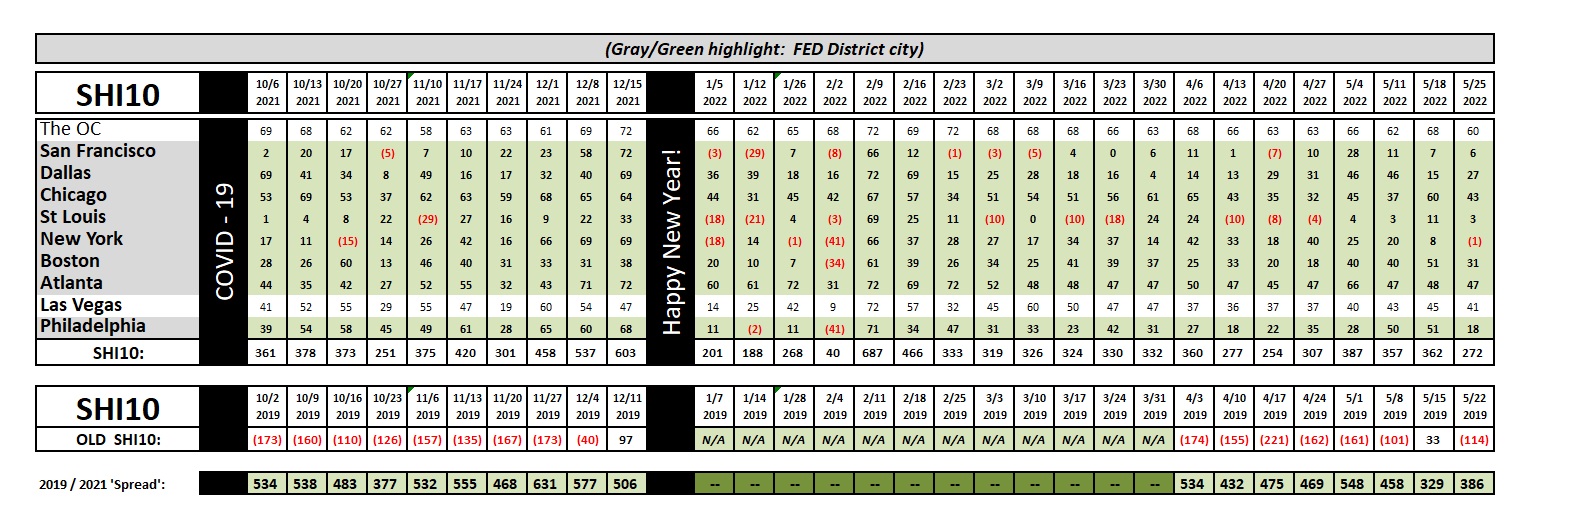
Above we see the longer term trend chart. This week marks “Week 20” for our data set. We now have 20 SHI10 readings since 1/5/2022.
Take a look at the SHI10 numbers in January of this year. January is a notoriously weak month for expensive steakhouse demand. The SHI10 readings year after year follow this trend. 2022 results were very much in line with the historic trend. By February, however, reservation demand exploded. The 2/9 reading hit the ‘high water’ mark for the year. Since then, with few exceptions, the SHI10 has been trending lower. Slowly. This week is no exception. Interestingly, to my eyes the SHI10 trend above is aligned with slowdowns and trajectory changes we’ve seen in the used car markets and the existing home markets across the US. Demand for opulent eatery reservations is slowing. It’s not falling off a cliff … but it is slowing. That appears to be the trend, and this read is plausible in light of the other data discussed above and in prior blogs. In my opinion …
The US economy is slowing.
The SHI10 and other data all seem to agree.
Which is why the FEDs recent behavior is so puzzling. Their actions and rhetoric of late seem to ignore these clear realities. They act as though current levels of consumer spending will continue, without reduction, irrespective of price. To me, their actions and words seem pretty dumb for a bunch of smart guys and gals.
Which makes me wonder: Am I missing something? Does the FED know something I don’t? That’s easy: Of course they do. They know a lot more than I do. Their data access and analytic tools are far, far superior to mine. And their army of economists are far smarter that I’ll ever be. I’m the dumbest guy in this room. 🙂
But I’m still puzzled. They act as thought their actions alone – and only their actions – will trim consumer demand. They seem to believe the markets will not self-correct at all. If only I could gain some further insight into their reasoning and choices. If only there was a way I could hear directly from the FED.
Fortunately for us, at 11 am today (CA time) they released the FED minutes from their May 3-4 meeting, where I found and ‘clipped’ this paragraph:
Participants agreed that the economic outlook was highly uncertain and that policy decisions should be data dependent and focused on returning inflation to the Committee’s 2 percent goal while sustaining strong labor market conditions.
At present, participants judged that it was important to move expeditiously to a more neutral monetary policy stance.
They also noted that a restrictive stance of policy may well become appropriate depending on the evolving economic outlook and the risks to the outlook. Participants observed that developments associated with Russia’s invasion of Ukraine and the COVID-related lockdowns in China posed heightened risks for both the United States and economies around the world. Several participants commented on the challenges that monetary policy faced in restoring price stability while also maintaining strong labor market conditions. In light of the high degree of uncertainty surrounding the economic outlook, participants judged that risk-management considerations would be important in deliberations over time regarding the appropriate policy stance.
Many participants judged that expediting the removal of policy accommodation would leave the Committee well positioned later this year to assess the effects of policy firming and the extent to which economic developments warranted policy adjustments.
I added the bold print and underlines, and enlarged the font of critically important comments. My take-away is this: Today, they feel they need to show the world an aggressive FED. One that is serious about crushing inflation. Uncertainty and risks are elevated. And for that reason, the FED believes their actions today will allow a re-assessment later this year depending on the data.
Am I confident the FED won’t misstep and crush the US economy simultaneously with their attempt to crush inflation? No. I’m not. But I feel a little better after reading these words.
I am confident, however, that the cure for high prices is high prices. Expect to see more demand destruction in the months to come. Our economy is slowing. The FED is now firmly in the driver’s seat, but they’re not driving a nimble, agile, responsive Ferarri, in spite of their hooting and hollering. Their vehicle is more akin to a massive, 6,000-room Carnival Cruise ship. It turns ever so slowly … and once it does, it’s pretty darn hard to change direction again.
<:> Terry Liebman


