
SHI 6.1.22 – More Whisper than JOLT

SHI 5.25.22 – Economic Long COVID
May 25, 2022
SHI 6.8.22 – Where Did You Go?
June 8, 2022
This morning, at 7 am Pacific, the most-recent JOLT report was released by the Bureau of Labor Statistics (“BLS”). I suspect that like me, FED Chair Powell anxiously awaited the report. And I’m sure he, too, was hoping it would reflect a sizable drop in the number of job openings.
But we were both disappointed. Job opening numbers were down, but not by much. The JOLT report measures the total number of “non-farm” job openings across America on a specific date. In this case, the date is April 30 – about 1 month ago. I’m confident the numbers have changed significantly since then, but like with all government data, we have to work with what we get, old data or not.
“
Demand for new employees is slowing.”
“Demand for new employees is slowing.”
The number of job openings did fall; however, not by much. On a percentage basis, the number of openings declined by about 3.8% — but that paltry reduction is from an all-time high number. And it is that exceptionally high number that has the me and Powell a bit anxious. Why is the JOLT number so important?
Welcome to this week’s Steak House Index update.
If you are new to my blog, or you need a refresher on the SHI10, or its objective and methodology, I suggest you open and read the original BLOG: https://www.steakhouseindex.com/move-over-big-mac-index-here-comes-the-steak-house-index/
Why You Should Care: The US economy and US dollar are the bedrock of the world’s economy.
But is the US economy expanding or contracting?
Expanding. Significantly. By the end of Q1, 2022, in ‘current-dollar’ terms US annual economic output clocked in at $24.38 trillion. Yes, during Q1, the current-dollar GDP increased at the annualized rate of 6.5%. The world’s annual GDP rose to about $95 trillion at the end of 2021. America’s GDP remains around 25% of all global GDP. Collectively, the US, the euro zone, and China still generate about 70% of the global economic output. These are the big, global players.
The objective of this blog is singular.
It attempts to predict the direction of our GDP ahead of official economic releases. Historically, ‘personal consumption expenditures,’ or PCE, has been the largest component of US GDP growth — typically about 2/3 of all GDP growth. In fact, the majority of all GDP increases (or declines) usually results from (increases or decreases in) consumer spending. Consumer spending is clearly a critical financial metric. In all likelihood, the most important financial metric. The Steak House Index focuses right here … on the “consumer spending” metric. I intend the SHI10 is to be predictive, anticipating where the economy is going – not where it’s been.
Taking action: Keep up with this weekly BLOG update. Not only will we cover the SHI and SHI10, but we’ll explore “fun” items of economic importance. Hopefully you find the discussion fun, too.
If the SHI10 index moves appreciably -– either showing massive improvement or significant declines –- indicating growing economic strength or a potential recession, we’ll discuss possible actions at that time.
The Blog:
Why is the JOLT report so important to me and Chairman Powell? It’s a litmus test measuring “pent-up” demand for new employees. At current levels, pent-up demand is high — too high. It needs to fall. Powell is concerned — for good reason — it could trigger even higher inflation, primarily wage inflation.
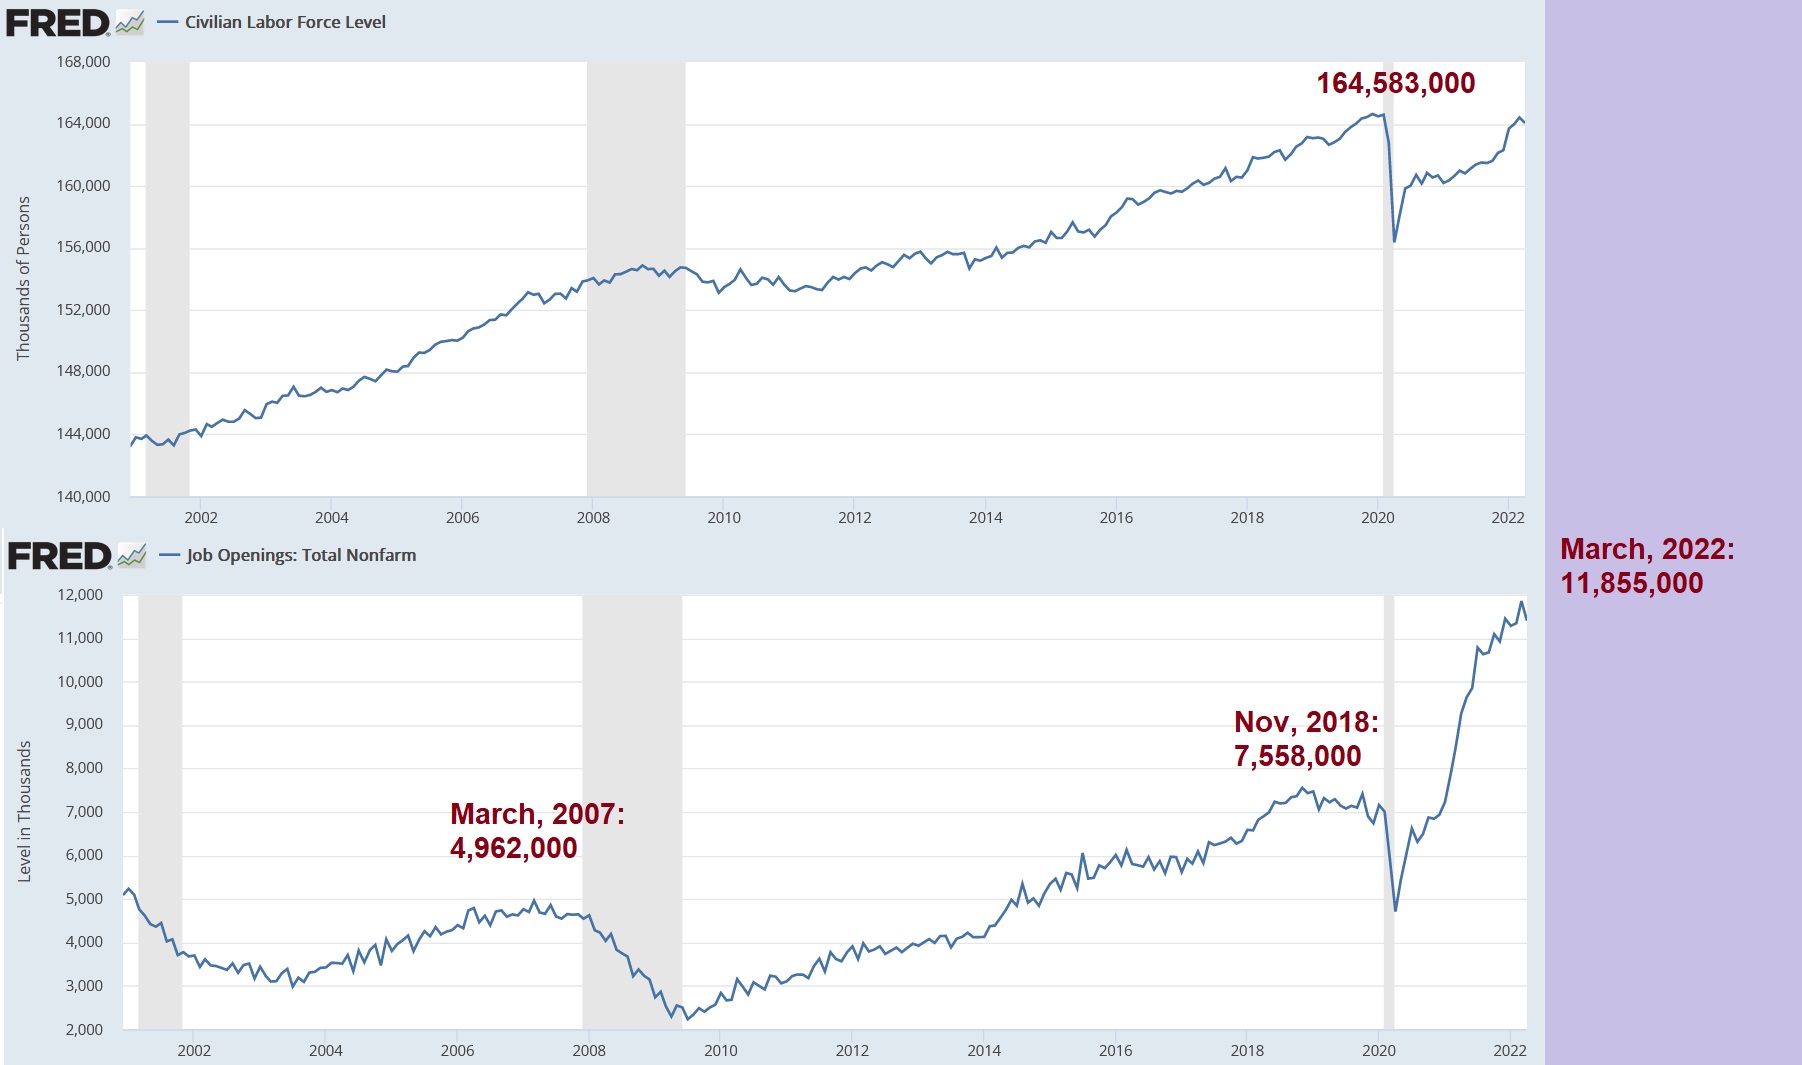
Let me explain it this way. For contextual purposes, I’ve taken and combined two (2) charts from the St Louis FED data site into the single image below.
The top graph reflects the total size of our civilian labor force (“CLF”). The CLF has consistently grown over the past 2 decades. From around 144 million back in 2002 to almost 165 million today. The pandemic response, as we all know, temporally pushed about 8 million folks to the side lines, for a time reducing the labor force to around 156 million people. It’s important to note that the CLF is a different measure than the number of unemployed. While the CLF fell by about 8 million post-pandemic, the number of employed people declined by almost 22 million people at low ebb in April of 2020.
Many of those folks became employed again. But many left the labor force. The most recent data shows that the current total number of “non-farm” employees has not eclipsed the high-water mark set in February of 2020 – 152,504,000. As of April, 2022, the number of employed Americans clocked in at 151,314,000 – or almost 1.2 million folks less.
At the same time, with the unemployment rate near 50-year lows, the number of job openings across the country has continued to grow. Even pre-pandemic – as you can see below – the JOLT report reflected a sizable lift in the number. For decades, the number of job openings hovered between 3 million and 5 million. But by November of 2018, the number peaked at over 7.5 million – more than a 50% increase over historic trends.
And then, post pandemic, the number skyrocketed, peaking in March of 2022 at 11.855 million. From an average of, say around 4 million, the number of open job positions seeking a new employee, peaked at just under 12 million. And this happened simultaneously with a 5-decade low unemployment rate and a relatively unchanged civilian labor force. If you’re looking for the source for the quantum-shift in “power” from the employer to the employee, look no further. Today, the employee is the proverbial tail wagging the dog. These conditions, of course, also explain the significant increase in employee hourly compensation – up about 5.5% in one year.
Summarizing thru another lens, for decades the number of job openings hovered around 2.5% of the civilian labor force. For decades. Right now, job openings total 7.3% of the CLF – an almost 300% increase. The reason for high turnover rates, low unemployment rates, and significant wage increases is clear.
Unless and until the number of job openings falls significantly, I expect the FED to keep their foot firmly on the brake known as “quantitative tightening.” They will continue to raise rates, shrink the balance sheet, and “talk trash” about inflation — and their commitment to CRUSH IT!
They must. The “average” consumer “hears” the trash talk and understands it. In order to prevent inflation expectations from embedding, the FED must display strong commitment to bringing inflation down. People need to hear it. Until, of course, conditions have changed enough to permit them to ease up on the brakes. I believe next months JOLT report will give them precisely that data. Sure, at the end of April job openings fell by almost a half million. But at the end of May — basically yesterday — I expect the JOLTs report to show at least 2 million fewer open positions. But we’ll have to wait another month before the data arrives. By then, I suspect you will have forgotten my prediction. But if I’m right, I’ll remind you. 🙂
Without further ado, let’s head to the steak houses.
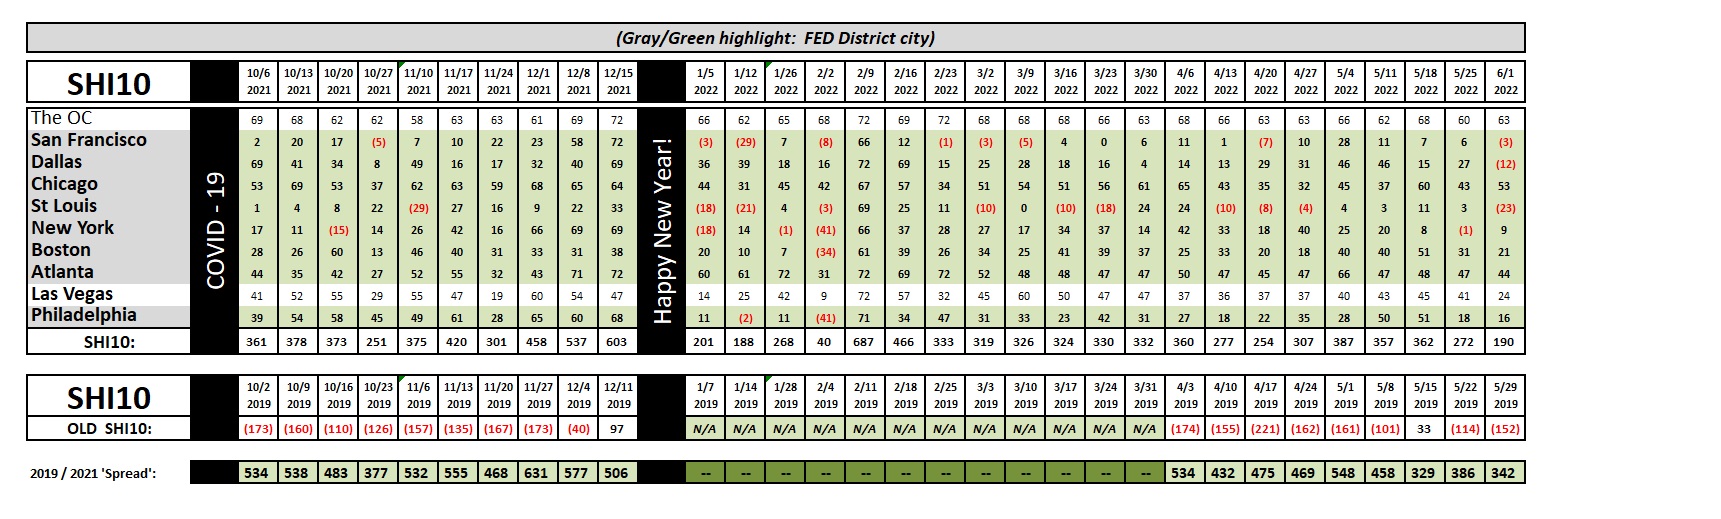
Reservation demand is down. For the first time since February, our opulent eateries in three (3) of our ten (10) SHI cities are back in the red. Reservation demand for a party of four this Saturday in St Louis is quite weak. Interestingly, expensive steak house demand remains quite strong in Chicago, Atlanta and here in “The OC.” As you can see above, demand in Dallas is low this week by historic standards in Dallas, an odd fact given the current price of oil. Perhaps it’s an aberration? And ‘Vegas is a bit softer this week, too. Again, an aberration? Overall, however, the SHI10 reading of 190 is the lowest since that same week in February. Hmmm….
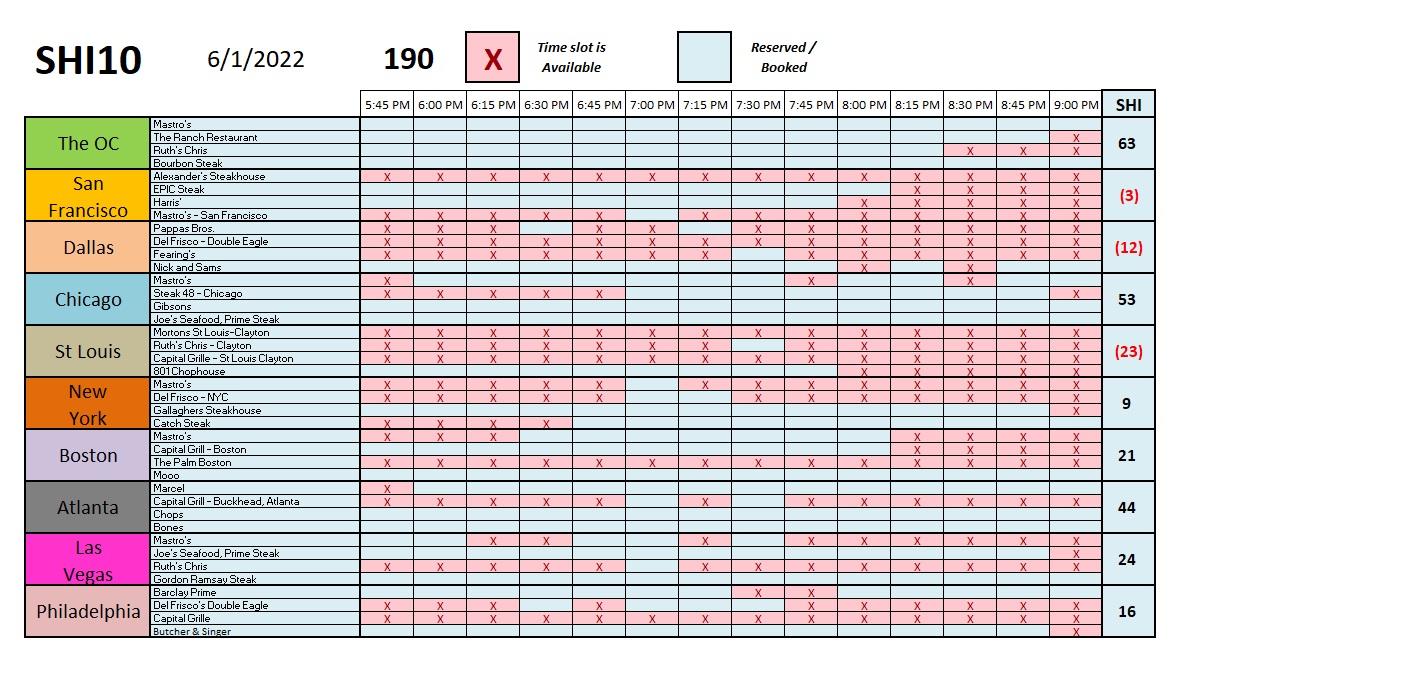
Here is the individual city report:
Summarizing, data this week suggests a slowing US economy. The number of job openings at the end of April per the JOLTs report declined almost 4% from historic highs. That’s an indication of minor weakness. The SHI10 is telling the same story. Not uniformly across all markets, of course, but some of the SHI markets are clearly having trouble finding well-heeled patrons for their empty seats. So far, the slowing is not significant. Next week we’ll see if it picks up pace.
<:> Terry Liebman


