
SHI 6.5.19 – Battle Rope Exercises

SHI 5.29.19 A Tale of Two Viewpoints
May 29, 2019SHI 6.12.19 – Where Did Inflation Go?
June 12, 2019
“Think of the Treasury yield curve as a battle rope.”
Imagine this: The guy in the blue represents both the FED Chairman Powell and ‘bond traders’ in the aggregate. The bond traders have pushed down the long-end of the yield curve — just like the blue guy (left hand) — in an attempt to influence Chairman Powell after Powell pushed up the short-end of the curve (right hand) over the past year or so. Today, the bond traders think market conditions will force the FED to act … and lower short-term rates. Here was Powell’s comment, somewhat on point, in a speech on Tuesday of this week:
“We do not know how or when these issues will be resolved,” Powell said. “We are closely monitoring the implications of these developments for the U.S. economic outlook and, as always, we will act as appropriate to sustain the expansion, with a strong labor market and inflation near our symmetric 2% objective.”
‘We will act as appropriate to sustain the expansion’. Hmmm….sounds like a rate cut may be in the cards after all. What’s the probability of a rate cut, according to traders? Almost 100%. I’ll explain below.
Welcome to this week’s Steak House Index update.
If you are new to my blog, or you need a refresher on the SHI10, or its objective and methodology, I suggest you open and read the original BLOG: https://www.steakhouseindex.com/move-over-big-mac-index-here-comes-the-steak-house-index/
Why You Should Care: The US economy and US dollar are the bedrock of the world’s economy. This has been the case for decades … and will be true for years to come.
But is the US economy expanding or contracting?
According to the IMF (the ‘International Monetary Fund’), the world’s annual GDP is about $80 trillion today. US ‘current dollar’ GDP now exceeds $21 trillion. In Q1 of 2019, nominal GDP grew by 3.8%…following a 4.1% increase in Q4, 2018. We remain about 25% of global GDP. Other than China — a distant second at around $12 trillion — the GDP of no other country is close. We can’t forget about the EU — collectively their GDP almost equals the U.S. So, together, the U.S., the EU and China generate about 2/3 of the globe’s economic output. Worth watching, right?
The objective of the SHI10 and this blog is simple: To predict US GDP movement ahead of official economic releases — an important objective since BEA (the ‘Bureau of Economic Analysis’) gross domestic product data is outdated the day it’s released. Historically, ‘personal consumption expenditures,’ or PCE, has been the largest component of US GDP growth — typically about 2/3 of all GDP growth. In fact, the majority of all GDP increases (or declines) usually results from (increases or decreases in) consumer spending. Consumer spending is clearly a critical financial metric. In all likelihood, the most important financial metric. The Steak House Index focuses right here … on the “consumer spending” metric. I intend the SHI10 is to be predictive, anticipating where the economy is going – not where it’s been.
Taking action: Keep up with this weekly BLOG update. Not only will we cover the SHI and SHI10, but we’ll explore related items of economic importance.
If the SHI10 index moves appreciably -– either showing massive improvement or significant declines –- indicating growing economic strength or a potential recession, we’ll discuss possible actions at that time.
The BLOG:
The probability of a rate cut — in Australia — is 100%. For the first time in 3 years, just yesterday Australia’s ‘Reserve Bank of Australia‘ or the RBA, cut their ‘benchmark’ short-term rate by .25%, to 1.25%. You may recall that Australia has enjoyed an economic expansion lasting almost 28 years. And they just cut their short-term rates. Why?
For the same reason the US might. Like Chairman Powell of the FED, the RBA is concerned about the possibility of a recession. And they are using all tools available to prevent that outcome. The FED has not cut the funds rate yet.
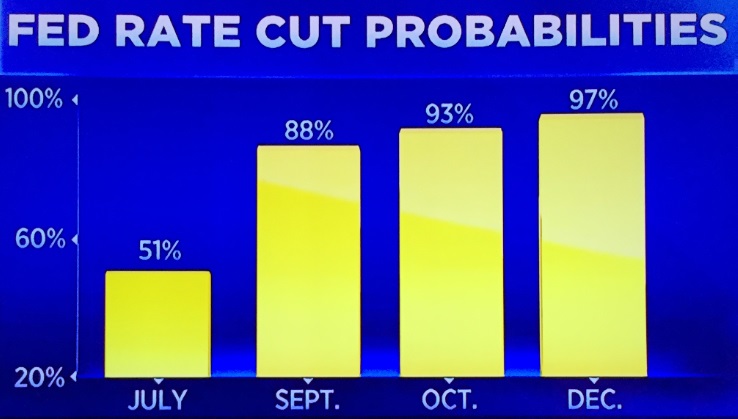
The chart to the right is a screen shot from a Tuesday CNBC episode. It shows how traders are handicapping the probability of a FED funds rate cut later this year. By the end of the year, traders are almost completely convinced the FED will cut rates, just like Australia did yesterday.
Will they? Perhaps. I’m not yet convinced, but I’m watching closely. But remember: The ‘battle rope game’ is in full swing. Traders are aggressively buying the 10-year Tbill, rapidly pushing down the long-end of the curve. As I write this blog the 10-year Treasury is down to 2.12% — a full 10 basis points below last week’s already low reading.
The 1-, 2-, and 3-month Treasury is currently trading around 2.35%. The 2-, 3-, and 5-year Treasuries are nearer to 1.85%. And the 30-year Treasury is down to 2.6%. Like the battle rope in the picture above, the middle of the “curve” is far below both ends of the curve, or rope. This condition, known as ‘curve inversion’ is one that the market tends to correct over time. The current inversion, according to the bond traders, must be corrected by the FED via a FED rate decrease.
Again, perhaps. The FED is clearly concerned about our economy. And they are not alone. Earlier today, the World Bank lowered their forecast for global GDP growth during 2019 and 2020. For the same reasons that Australia lowered rates yesterday, and the FED is worried, the World Bank has cut their forecasted global growth rates.
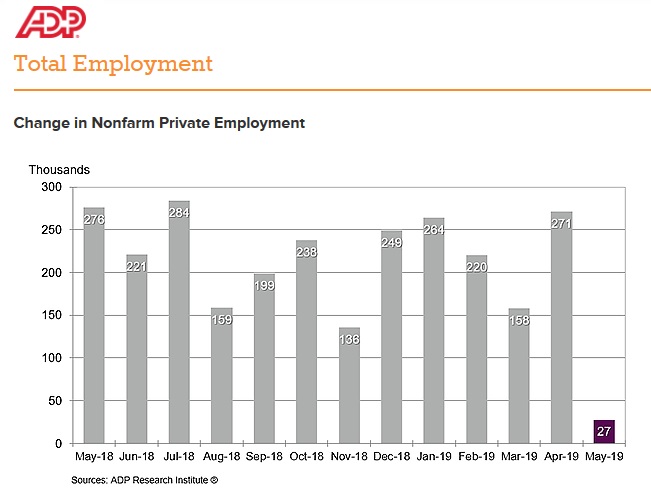
So, is all this simply a manifestation of Shakespear’s comedy, “Much ado about nothing” or is there something to worry about here? Feel free to worry. We have plenty of data from numerous sources to become concerned. The latest example is the ADP ‘jobs report’ released just hours ago … take a look at this graphic:
Remember that while ADP is pretty good at forecasting job growth, the real number will be out on Friday, courtesy of the BLS. Get out of bed Friday morning at 5:30 AM (pacific), turn on CNBC, and you can see news release live. Or wait until later. The number won’t change.
But will the BLS report show a similar paltry job gain? If it does, that’s bad. For a few reasons. First, 27,000 new jobs isn’t enough to put all the new folks joining the ‘Civilian Labor Force‘ in May to work. Which is really bad. Secondly, absent some of the voodoo math we sometimes see in the BLS employment report, the unemployment rate will increase. Also really bad. OK, one month does not make a trend. But you may recall the weak February jobs report where only 56,000 new jobs were created. Look above and you’ll see ADP forecasted 220,000 new jobs were created in February. They were way off. So Friday’s number is important. And with the FEDs favorite inflation metric — the PCE — hanging low, near 1.5%, they hold the right cards for a rate cut.
If the jobs number is this bad, I think the odds of a near-term FED rate cut increase significantly. Perhaps up into the 90% range. So tune in on Friday and stay informed. Now let’s see what the steak houses are whispering to us. Here’s the trend report:

Well, our extravagant eateries are suggesting continued softness — if not, increased softness — in reservation demand. Steak-o-nomics appears to be in sync with the the FEDs feelings: The data is soft, much like a double-baked potato. Remember: Our economic experiment is a meaty, epicurean journey, intended to improve our digestion of economic data. Keep chewing on the data … and if you have any questions, shoot them my way. 🙂
The SHI10, our barometer for US economic expansion, is flashing warning signs. We see this fact in the line added above, “2018/2019 ‘Spread’. Early in this quarter, the SHI10 for 2019 was significantly weaker than last year. And this week, once again, the spread between 2018 and 2019 is over 100 points. Many of our SHI markets below show NO reservation demand for this coming Saturday:

Dallas has joined Philly and Miami at a reading of negative <44> — the lowest possible SHI reading. Said another way, every single time slot is available this Saturday for a table of four. That’s not good. Not for the restaurant … nor our economy.
Warning signs are flashing. Let’s see what Friday’s employment report says. And how the FED responds. Juicy stuff! 🙂
- Terry Liebman


