
SHI 8/23/17: Nowcasting GDP

SHI 8/16/17: Cornucopia
August 16, 2017
SHI 8/30/17: A Rising Tide …
August 30, 2017
Nowcasting is the process of using the latest available economic information to forecast current-quarter growth in inflation-adjusted (real) GDP.
I didn’t write the sentence above.
It comes from a St. Louis FED article published in April of 2016 explaining the reasons behind the NY and Atlanta FEDs ‘nowcasting’ efforts. In a nutshell, the article comments, since FED decisions to raise or lower interest rates are “data-dependent” the nowcast is a valuable tool used by the FED to forecast the economy’s performance — in real time.
Since the FED considers the NY and Atlanta nowcasts valuable, perhaps we should take another look?
Welcome to this week’s Steak House Index update.
As always, if you need a refresher on the SHI, or its objective and methodology, I suggest you open and read the original BLOG: https://www.steakhouseindex.com/move-over-big-mac-index-here-comes-the-steak-house-index/
Why You Should Care: The US economy and US dollar are the bedrock of the world’s economy. At present, is the US economy expanding or contracting? We need to know.
The world’s GDP is about $76 trillion. At last count, our ‘current dollar’ US GDP is now over $19 trillion — about 25% of the total. No other country is even close.
The objective of the SHI is simple: To help us predict US GDP movement ahead of official economic releases — important since BEA data is outdated the day they release it.
‘Personal consumption expenditures,’ or PCE, is the single largest component of US GDP — about 2/3 of the total. In fact, the majority of all US GDP increases (or declines) usually result from (increases or decreases in) consumer spending. Thus, this is clearly an important metric to track. The Steak House Index focuses right here … right on the “consumer spending” metric.
I intend the SHI is to be predictive, anticipating where the economy is going – not where it’s been. Thereby giving us the ability to take action early.
Taking action: Keep up with this weekly BLOG update.
If the SHI index moves appreciably -– either showing massive improvement or significant declines –- indicating expanding economic strength or a potential recession, we’ll discuss possible actions at that time.
The BLOG:
The GDPNow model created and used by the Atlanta FED is very sophisticated. It is far more sophisticated than the simplistic framework and design of the SHI. It even sounds more sophisticated:
“The GDPNow model forecasts GDP growth by aggregating 13 subcomponents that make up GDP with the chain-weighting methodology used by the U.S. Bureau of Economic Analysis….” is how a 2014 working paper from the Federal Reserve Bank of Atlanta describes the analysis. Very impressive! The Atlanta FED updates the GDPNow prediction 2 or 3 times each week and publishes a new prediction every 7-10 days. Their next prediction will be published on August 25th. You can read the latest here: https://www.frbatlanta.org/cqer/research/gdpnow.aspx
13 subcomponents? “Chain-weighting” methodology? Wow! And to think the SHI simply tracks expensive steaks and potatoes! 🙂
But is the GDPNow accurate?
The Federal Reserve Bank of New York (“the NY FED”) publishes their nowcast every Friday — except on federal holidays. 🙂 Here’s a link to their forecast: https://www.newyorkfed.org/research/policy/nowcast.html
Their methodology, too, is quite complex. Unlike the Atlanta FED, the NY FED chooses not to release their precise underlying data:
“We are not making the underlying data available at this time. The tables list the data series employed in calculating our estimates. Sources include the U.S. Bureau of Labor Statistics, Institute for Supply Management, U.S. Census Bureau, U.S. Bureau of Economic Analysis, the New York and Philadelphia Feds, the Fed Board of Governors, and ADP.”
How accurate is the NY FED forecast?
The most recent update for the Atlanta GDPNow is August 16th. Their 2017 Q3 forecast for GDP growth now stands at 3.8%. Hmmm…that’s much higher than the SHI is predicting. While the SHI doesn’t offer a precise numeric forecast, I would say the SHI is predicting an annualized Q3 GDP growth rate between 1.0% and 1.8%. Clearly we can’t both be right.
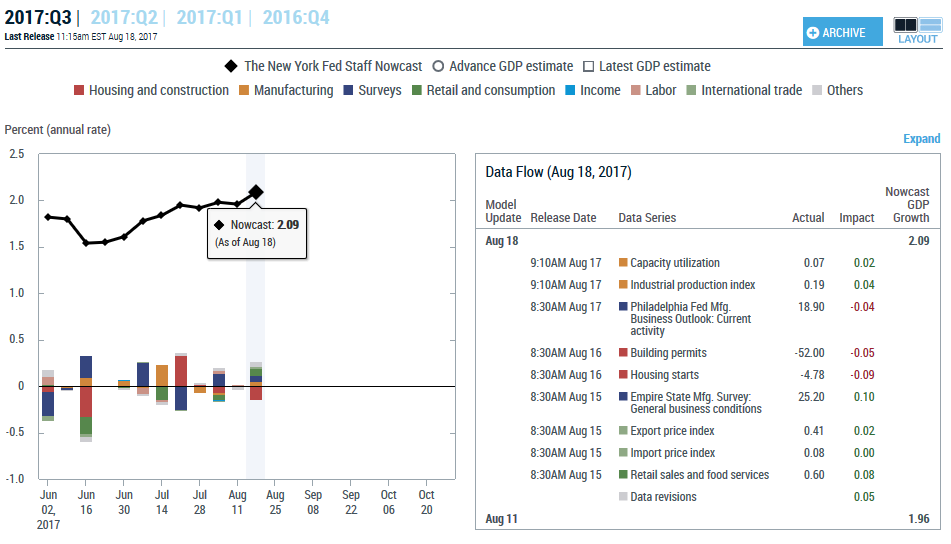
The New York FED nowcast, on the other hand, is much closer to my expected outcome: As of August 18th, the NY FED predicted a 2017 Q3 reading of 2.1%.
Here is the most recent image, as I wrote this week’s blog, from the Atlanta FED:
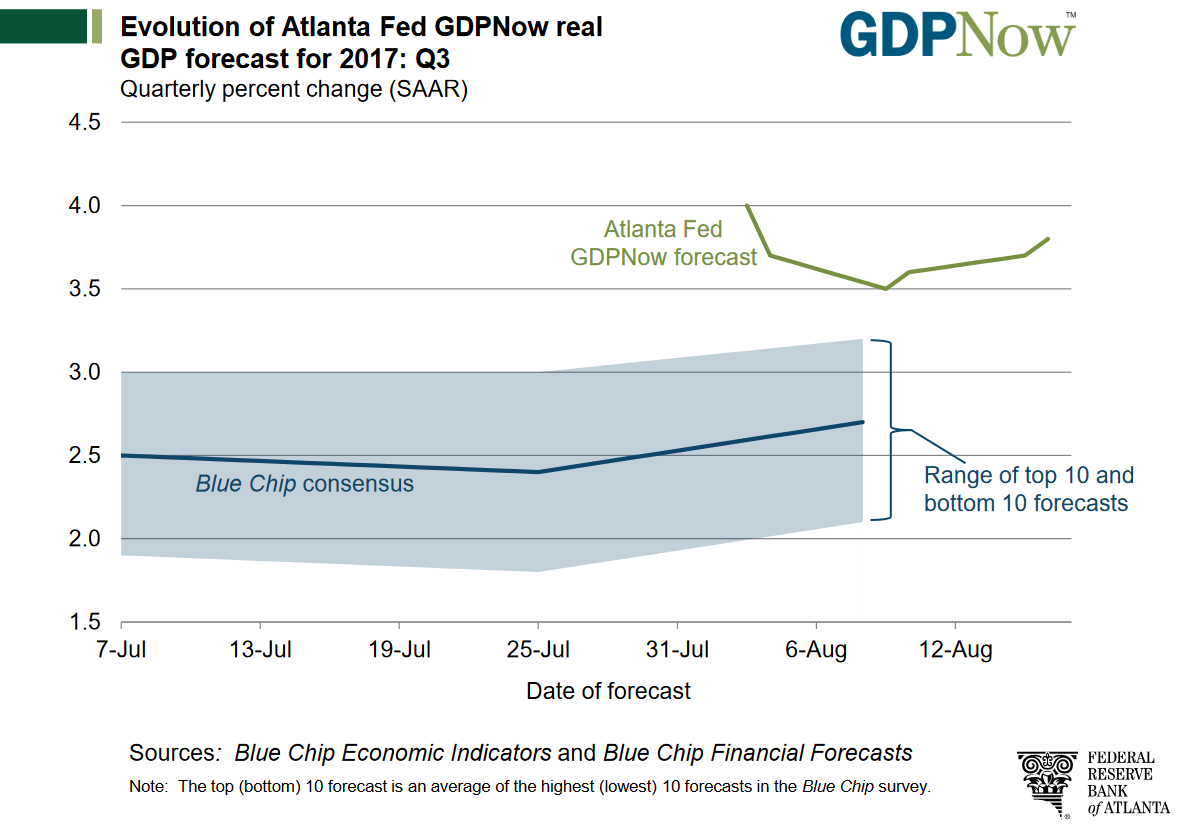
It’s interesting to note their forecast (see the green line — top right) is quite a bit higher than the “Blue Chip” consensus forecast.
At 2.1%, the NY FED forecast is well within the lower-range of the “Blue Chip” forecast highlighted above. Here’s the most recent image from the NY Fed nowcast:
Let’s get back to my earlier questions — how accurate are their forecasts? Let’s take a look at prior results.
The chart below reflects the actual ‘real’ GDP readings for the last six (6) quarters as reported by the BEA. The NY Fed nowcast and the Atlanta GDPNow figures in the chart represent the final published ‘nowcast’ forecast before each calendar quarter ended:
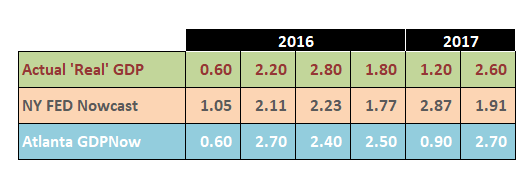
Atlanta was spot-on in Q1, 2016. The NY Fed almost nailed it in Q4, 2016. Atlanta was also pretty close in their Q2 GDP estimate earlier this year.
It appears their forecast accuracy has been fair. Which makes me wonder — and probably you, too — if the SHI forecast is off … or if Atlanta’s estimate is off. Is the SHI a tasty tidbit, but a meaningless economic forecasting tool? Perhaps … we’re still testing it.
Or, alternatively, as 70% of our economy is driven by ‘personal consumption expendatures’ (PCE) — another name for ‘consumer spending’ — are is the SHI forecast unaligned with actual PCE growth? Are people actually spending more money than the SHI is predicting?
To answer this question, I decided to dig into the historical data behind Atlanta’s forecast. Here’s a chart showing Atlanta’s GDPNow forecasts this quarter (since July 1st) and the corresponding ‘PCE’ figure for each date:
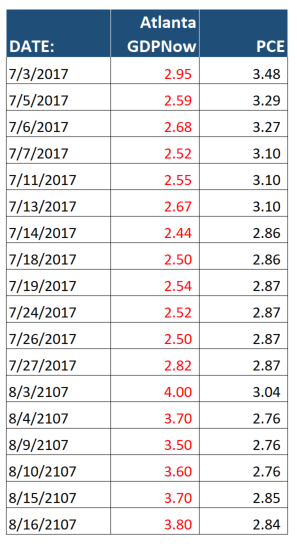
No. Their measure of PCE is declining as well. Consumer spending appear to be declining.
Some of the other 13 subcomponents may be driving UP their forecast. Possibly “investment in non-residential structure” and “exports.” Per the Atlanta FED numbers, both are showing significant improvement and strength this month. Which, if this continues all quarter, will definitely have a lifting effect on Q3 GDP. But, in my opinion, any lift in these areas will be more than offset by PCE decline. Remember, PCE contributes about 70% of all GDP growth.
So, who’s right? The SHI or the Atlanta FED? We’ll know soon enough.
What’s the SHI telling us this week? Well, yet again, pretty much the same:
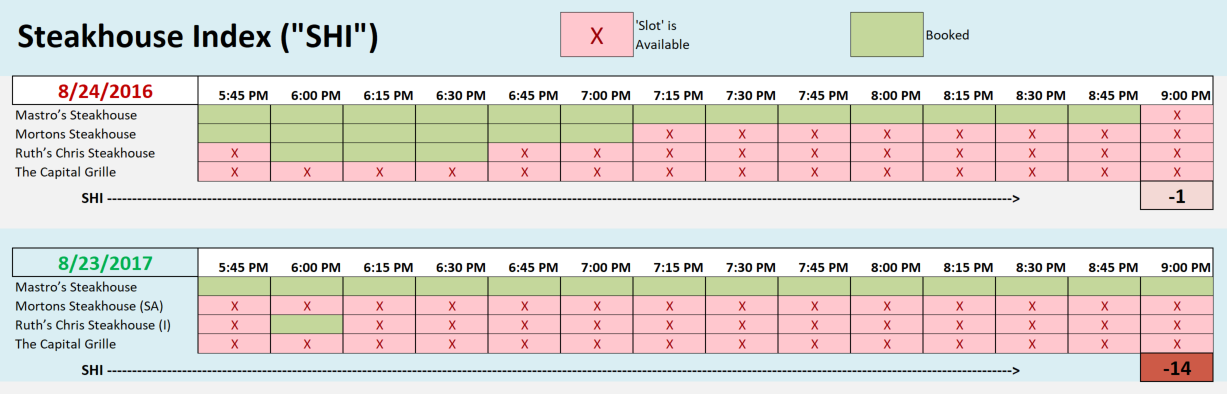
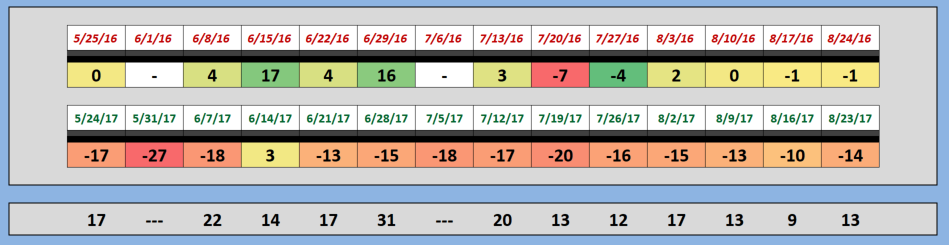
This week, the SHI is a negative <-14>. Mastros is fully booked once again, but with the exception of one booked slot at Ruths’ Chris, our other extravagant eateries are open and ready for your business. Looking at the longer-term trend report below, we see once again the SHI is 13 points below this same week last year.
Below is a screen shot from my “research” at OpenTable today at 11:00 am. Take a look at the green arrow: Per OpenTable, Mastro’s Ocean Club has been “booked 119 times” today. That’s impressive. Especially when compared to Mortons — another of our elegant watering holes:

Interesting. Mastro’s popularity is impressive.
Let’s circle back to the clear competition between the nowcast reports from both Atlanta and NY and our SHI. The SHI is painting a much more dismal picture than either of the forecasts. Again, as I said above, both cannot be correct.
Who will win? While Q3 ends with the last day of September, we will have to wait until October 27th at 8:30 AM (eastern time) to find out. I’m hoping for a photo finish! 🙂
- Terry Liebman


