
SHI 9.9.20 – Ask the Big Mac

SHI 9.2.20 – With Little Fanfare, A New Era Arrives
September 2, 2020
SHI 9.16.20 – Let’s Talk About Debt
September 16, 2020
Damn, that looks good.
But I’ve always been a Big Mac fan. On the other hand, if I’m being completely honest, they never look like that out of the box. And I mean never. I wish they did. Yum.
Speaking of “yum,” Yum Brands China is a massive food conglomerate operating throughout China. They have thousands of ‘Kentucky Fried Chicken,’ ‘Taco Bell,’ and ‘Pizza Hut’ restaurants dotting the landscape, and many other brands, including one called ‘Little Sheep.’ I wonder what they serve? Poor little sheep.
Anyway, by now, you may be wondering why I’m sharing this meandering food journey. Trust me, there’s a point to all this. And the Big Mac plays a prominent role.
” How does the Big Mac fit in? “
The BIG MAC index was invented by The Economist magazine back in 1986. They describe it “as a lighthearted guide to whether currencies are at their “correct” level. It is based on the theory of purchasing-power parity (PPP), the notion that in the long run exchange rates should move towards the rate that would equalize the prices of an identical basket of goods and services (in this case, a burger) in any two countries.”
So that is how the Big Mac fits in. And assuming we believe the BMI is more indicative than lighthearted, it triggers some very interesting corollaries. Let’s talk about one.
Welcome to this week’s Steak House Index update.
If you are new to my blog, or you need a refresher on the SHI10, or its objective and methodology, I suggest you open and read the original BLOG: https://www.steakhouseindex.com/move-over-big-mac-index-here-comes-the-steak-house-index/
Why You Should Care: The US economy and US dollar are the bedrock of the world’s economy.
But is the US economy expanding or contracting?
Before COVID-19, the world’s annual GDP was about $85 trillion. No longer. It will shrink thanks to ‘The Great Lockdown.’ I did not coin this phrase — the IMF did. The same folks who track global GDP. Until recently, annual US GDP exceeded $21.7 trillion. Again, no longer. But what has not changed is the fact that together, the U.S., the EU and China still generate about 70% of the global economic output.
The objective of this blog is singular.
It attempts to predict the direction of our GDP ahead of official economic releases. Historically, ‘personal consumption expenditures,’ or PCE, has been the largest component of US GDP growth — typically about 2/3 of all GDP growth. In fact, the majority of all GDP increases (or declines) usually results from (increases or decreases in) consumer spending. Consumer spending is clearly a critical financial metric. In all likelihood, the most important financial metric. The Steak House Index focuses right here … on the “consumer spending” metric. I intend the SHI10 is to be predictive, anticipating where the economy is going – not where it’s been.
Taking action: Keep up with this weekly BLOG update. Not only will we cover the SHI and SHI10, but we’ll explore related items of economic importance.
If the SHI10 index moves appreciably -– either showing massive improvement or significant declines –- indicating growing economic strength or a potential recession, we’ll discuss possible actions at that time.
The BLOG:
‘Burgernomics‘, economics with a ‘secret sauce,’ is a term coined by The Economist magazine around the same time they came up with the BMI. Bugernomics, like economics, is effectively a yardstick created to measure economic activity, but with a twist. Thru the lens of the BMI we learn that while a dollar is a dollar is a dollar, the cost of living in other countries, when measured against that dollar, varies significantly. In other words, a dollar goes further in many other countries. You can purchase “more of the same stuff,” in the country’s local currency, than the currency exchange rate suggests.
The economic term for this disparity is “purchasing-power parity.” Essentially, purchasing-power parity, or PPP, is more of a result or calculation. PPP is determined by comparing the cost of “the same stuff” in two different countries. For example, let’s say “country X” has a PPP of 0.5. This suggests that for a given sum of US dollars, you can buy twice as much of “the same stuff” in that country than you could in the US. If the PPP equals 1, then”the same stuff” costs the same in both countries. If the PPP is greater than 1, then that ‘basket’ of “the same stuff” costs more in that country, when compared to the US. Make sense?
Why is this important? For this reason: The dollar goes farther in many countries. Like in China, for example. As you can see from the graphic below, again courtesy of The Economist magazine, China has a PPP of about 0.5 and Switzerland, about 1.2.
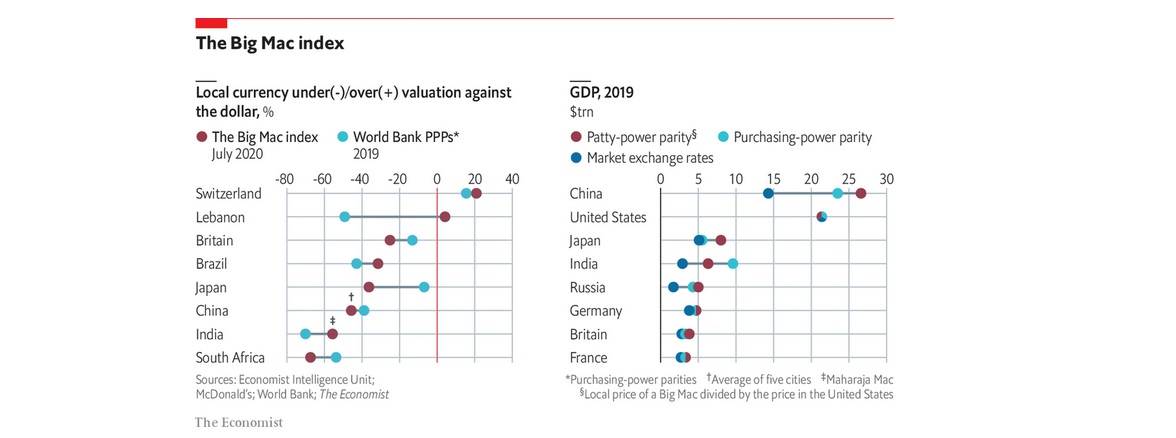
Which means, effectively, the cost of living in China is about 1/2 of that in the US. Said another way, if you lived in, and earned $50,000 per year in China, you would have the spending power of $100,000, measured against the same spending power you would have if you lived in the US. The same dollar goes further in China.
In 2019, one US dollar would buy, on the average, about 6.9 yuan — China’s currency. But while the ‘official’ exchange rate is 6.9 yuan = 1 dollar, we now know the ‘dollar-equivalent yuan’ stretches further in China than a dollar does in America. One example is the Big Mac. A Big Mac will set you back about 21.70 yuan in China and $5.71 in America, according to prices collected by The Economist. So, doing the math, 3.8 yuan buys as much as a dollar. Clearly, in China a Big Mac costs quite a bit less — in the local currency — than it does in the US. This relationship holds true with many other goods and services.
In 2019 China’s workers collectively produced a little less than 100 trillion yuan-worth of goods and services, meaning this was China’s GDP when measured in yuan. Compared the US 2019 GDP of $21.7 trillion dollars, China’s GDP was quite a bit smaller, since 6.9 yuan bought one dollar last year. On a currency-to-currency comparison, China’s GDP was worth only $14 trillion after conversion. Far short of the US output.
But if we instead compare the output using PPP vs. the ‘official’ currency exchange rate, then 99trn yuan spent in China can buy as much of “the same stuff” as $26 trillion. So, thru this lens China’s economy is already considerably bigger than America’s.
It’s an interesting perspective … especially given that even in dollar terms, China’s GDP continues to gain ground on that of the US. The Coronavirus didn’t help. During Q2, 2020, China says their economy grew at the annualized rate of 3.2%. The US economy, on the other hand, shrunk at the annual rate of 32.9% in Q2. Ouch.
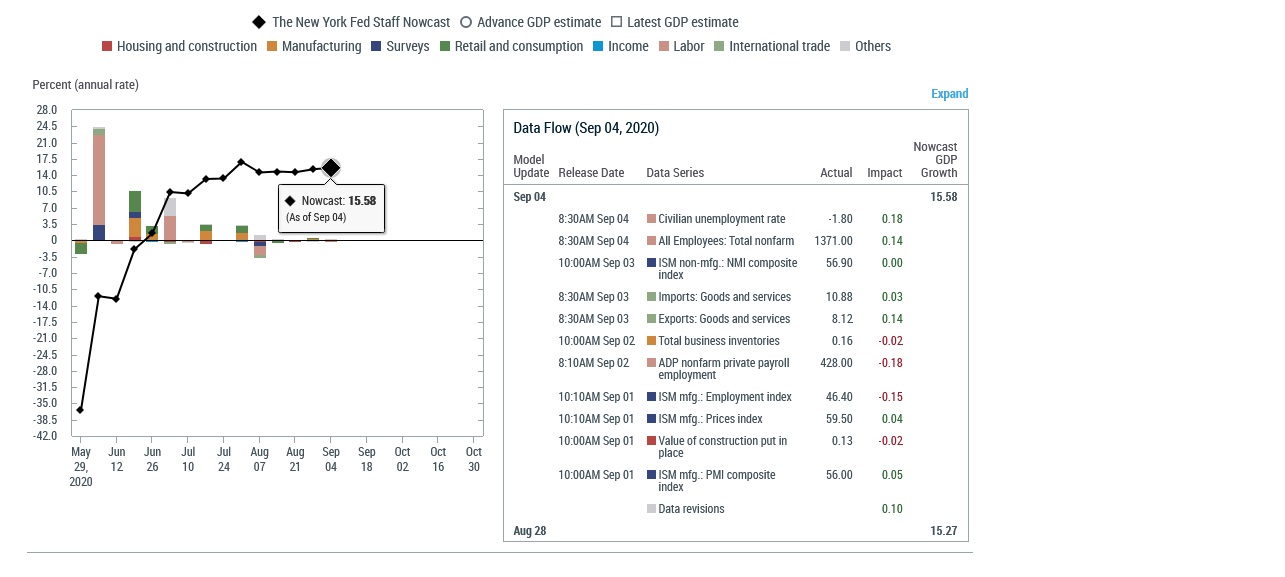
Q3 is looking better. Thankfully. According to the NY Federal Reserve, GDP in the current quarter is now growing at the annualized rate of 15.58%:
The Federal Reserve Bank of Atlanta ‘GDPNow’ model offers an even higher estimate: As of 9/3, they are forecasting real GDP growth in the third quarter of 2020 is 29.6 percent.
Both forecasts are good news for the economy. In the race against China, we’re picking up some ground in Q3.
But the question remains: Is our GDP larger … or has China surpassed us? I guess it all depends on your point of view. In dollars, via official exchange rates, our economic output is still far bigger than China’s. But on a purchasing power basis, China is much larger that we. If you lived in China, 1,000 dollars US buys about $2,000 worth of the same stuff.
Of course, you would have to live in China to gain 2X the spending power. But right about now, some folks might be thinking that sounds pretty good. 🙂
- Terry Liebman


