2017 Storm Clouds on the Horizon?
January 2, 2017Move Over, Saudi Arabia!
January 8, 2017
2017 is here!
Will our local, well-heeled folks continue to consume high-dollar steaks and expensive bottles of wine at the same frenetic pace as December? Or have our four elite eateries fallen on slow times … with plenty of open tables for this weekend? The intrigue is downright palpable! 🙂
Welcome to the first Steak House Index update of 2017.
By the way, I think you know I’ve migrated this BLOG to a new URL – https://www.steakhouseindex.com/ The reading experience on the site is much better than in the email form. I suggest you click the preceding link and give it a try!
Why You Should Care: The US economy and US dollar are the foundation of global economics: our nominal GDP is over $18.5 trillion a year. Is it growing or shrinking? Is it possible to know – before the quarterly GDP releases from the BEA?
The objective of the SHI is simple: To predict the direction of this behemoth ahead of official economic releases. But while the objective is simple, the task is not.
BEA publishes GDP figures the instant they’re available. Unfortunately, it is a trailing index. The data is old news; it’s a lagging indicator.
‘Personal consumption expenditures,’ or PCE, is the single largest component of the GDP. In fact, the majority of all GDP increases (or declines) usually result from (increases or decreases in) consumer spending. Thus, this is clearly an important metric to track.
I intend the SHI is to be predictive, anticipating where the economy is going – not where it’s been. Thereby giving us the ability to take action early. Not when it’s too late.
Taking action: Keep up with this weekly BLOG update. If the SHI index moves appreciably – either showing massive improvement or significant declines – indicating expanding economic strength or a potential recession, we’ll discuss possible actions at that time.
The BLOG: The prior two SHI readings were the highest since the inception of the Steak House Index:
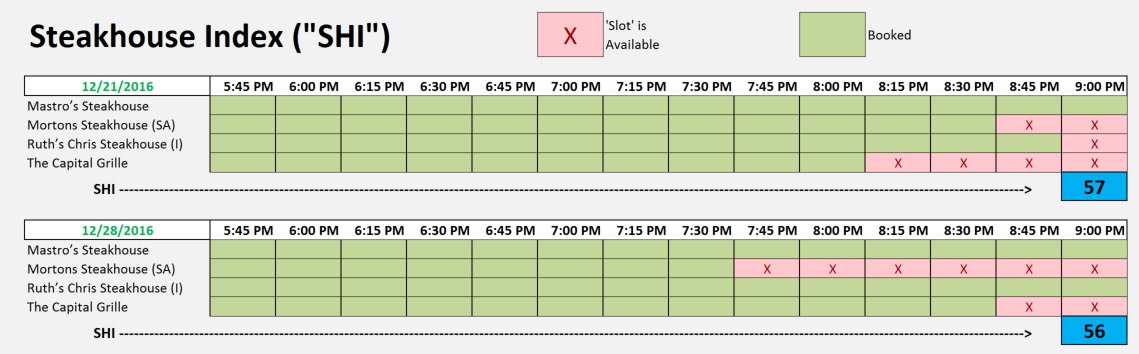
During most of 2016, our algorithm typically generated SHI readings within 10 points – either way – of zero. Yet, our four (4) readings in December, were FAR higher – at a positive 10 or above. Suggesting December “food sales” are far greater than during the other 11 months. Is this a fact? Does December typically stand alone? On a pinnacle?
To answer that question, I spent some time researching “food sales” data at the Census Bureau. Each month, the CB produces a report entitled, “ADVANCE MONTHLY SALES FOR RETAIL AND FOOD SERVICES.” And they archive their data back to 1992. So it was easy to pull up the last FULL year of data – 2015. Separating food sales (alone) from food AND retail sales, and then calculating the month-over-month changes, generates these results:

Actual 2015 data suggests there is some seasonality in “food sales” – but not as much as our numbers might suggest. The food sales differences between December and January are meaningful – December is more than 14% higher than January – but don’t demonstrate the extreme magnitude our SHI readings have suggested.
Clearly, December was somewhat aberrational. Demand was off the charts. But by how much? And will our first January SHI reading reflect a December hangover and the almost guaranteed arterial sclerosis our ‘cholesterol consuming compatriots’ must be experiencing after the holidays?
Well, without further ado, let’s see how this week’s SHI number looks … drum roll please ………………………………………………

Interesting: This week our SHI algorithm has generated a reading of negative (-3). Fairly typical of much of last year. Of course, in the Saturday dinner reservation race the Capital Grille is dead last once again. Poor Capital Grille. Here’s the long-term trend since the inception of the SHI:

A negative (-3) SHI reading, given the historic weakness in January food sales, suggests the consumer consumption metric used to calculate the US GDP remains strong.
Once again, it appears the US economic recovery remains on solid footing.


1 Comment
Good info. Lucky me I reach on your website by accident, I bookmarked it.