
SHI Update 5/03/17: Tiny Bubbles

We Didn’t Spend Enough!
April 29, 2017
SHI Update 5/10/17: Flying High
May 10, 2017
Fifty years ago, the song ‘Tiny Bubbles’ became a national sensation.
Fifty years ago, the song ‘Tiny Bubbles’ became a national sensation.
And like economic bubbles long since past and popped, I suspect most of you have never heard of the song made famous by Don Ho, the Hawaiian singer. Unlike bubbles in the song, tiny economic bubbles don’t remain tiny. They tend to become large. Eventually, they pop. One might be very close to popping right now, just to the north, in Canada.
The challenge, of course, is that bubbles are notoriously hard to identify and rarely pop when you expect them to. Which is why they’re hard to spot … and even harder to predict. Back in 2002, the Chairman of the FED, Ben Bernanke, famously posed the question, “Can the Federal Reserve reliably identify “bubbles” in the prices of some classes of assets, such as equities and real estate?”
Ben’s conclusion: “If we could accurately and painlessly rid asset markets of bubbles, of course we would want to do so. But as a practical matter, this is easier said than done…the Fed cannot reliably identify bubbles in asset prices.”
But I’ll go out on a limb: I believe we’re seeing a bubble right now in Canada’s house market.
My concern is contagion. Could a “pop” in Canada’s home prices be exported south of the border? Here in the US we like Canada’s high-quality lumber products, but we we don’t want their bubbles!
Shifting gears, on Monday the BEA updated “Personal Income and Outlays” for March where we learned why Q1 GDP growth was so weak. And we discovered the rate of inflation, measured by the PCE, declined during the month.
Welcome to this week’s Steak House Index update.
As always, if you need a refresher on the SHI, or its objective and methodology, I suggest you open and read the original BLOG: https://terryliebman.wordpress.com/2016/03/02/move-over-big-mac-index-here-comes-the-steak-house-index/)
Why You Should Care: The US economy and US dollar are the bedrock of the world’s economy. This has been true for decades…and notwithstanding plenty of predictions to the contrary, it will continue to play this role for years to come. Fear not.
Nominal global GDP is about $76 trillion. US GDP is almost $19 trillion. Is it growing or shrinking? If it’s growing … how rapidly? How might this information impact our daily financial and business decisions?
The objective of the SHI is simple: To predict the GDP direction ahead of official economic releases. While the objective is simple, the task is not. BEA publishes GDP figures the instant they’re available. Unfortunately, the data is old, old news; it’s a lagging indicator.
‘Personal consumption expenditures,’ or PCE, is the single largest component of the GDP. In fact, the majority of all US GDP increases (or declines) usually result from (increases or decreases in) consumer spending. Thus, this is clearly an important metric to track.
I intend the SHI is to be predictive, anticipating where the economy is going – not where it’s been. Thereby giving us the ability to take action early. Not when it’s too late.
Taking action: Keep up with this weekly BLOG update. If the SHI index moves appreciably – either showing massive improvement or significant declines – indicating expanding economic strength or a potential recession, we’ll discuss possible actions at that time.
The BLOG: Their website reads: “Home Trust Company is one of Canada’s leading trust companies. We offer Canadians a wide range of financial product and service alternatives, including mortgages, VISA cards, deposits and retail credit services. We focus primarily on a unique segment of the Canadian marketplace: consumers who do not have traditional credit backgrounds and whose specific needs are not met by larger financial institutions. We cater to self-employed entrepreneurs, people with past credit issues and borrowers with equity in their property who do not qualify due to lack of provable income or little credit history.”
Sound familiar? Yes, Home Trust is Canada’s “sub-prime” home lender. Here’s their one-year stock performance:
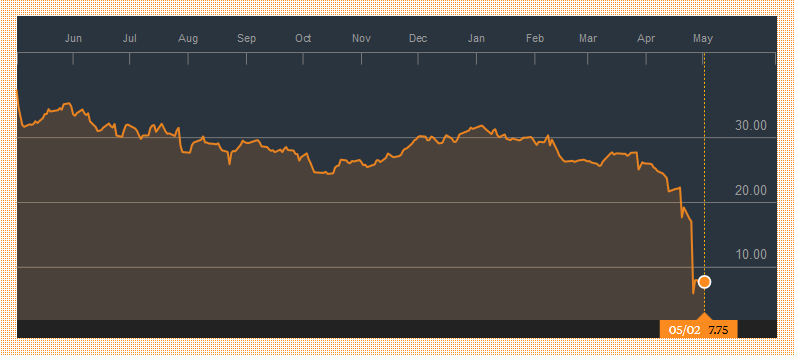
Yep. Not so hot. What caused this massive price slide? To quote a recent Bloomberg article, “The selloff in Home Capital’s stock (is) sparked by allegations that it misled investors about its mortgage (holdings.)”
Further per Bloomberg, “The Ontario Securities Commission last month accused Home Capital of misleading investors and breaking securities laws. The allegations stem from a 2014 internal probe that discovered 45 brokers who generated C$1 billion of mortgages for Home Capital falsified income information for borrowers on some of the mortgages. The OSC alleges that Home Capital failed to properly disclose the fraud to investors.”
Ouch. Again, sound familiar?
And the Canadian house market is on fire. While the ‘Home Capital’ stock price is down 66% since April 19th, Vancouver home prices are up 11% year-over-year, and condos are up over 17%. Clearly the Vancouver market remains buoyant, in spite of the BC 15 percent “foreign-buyer tax.” But this is nothing compared to Toronto:
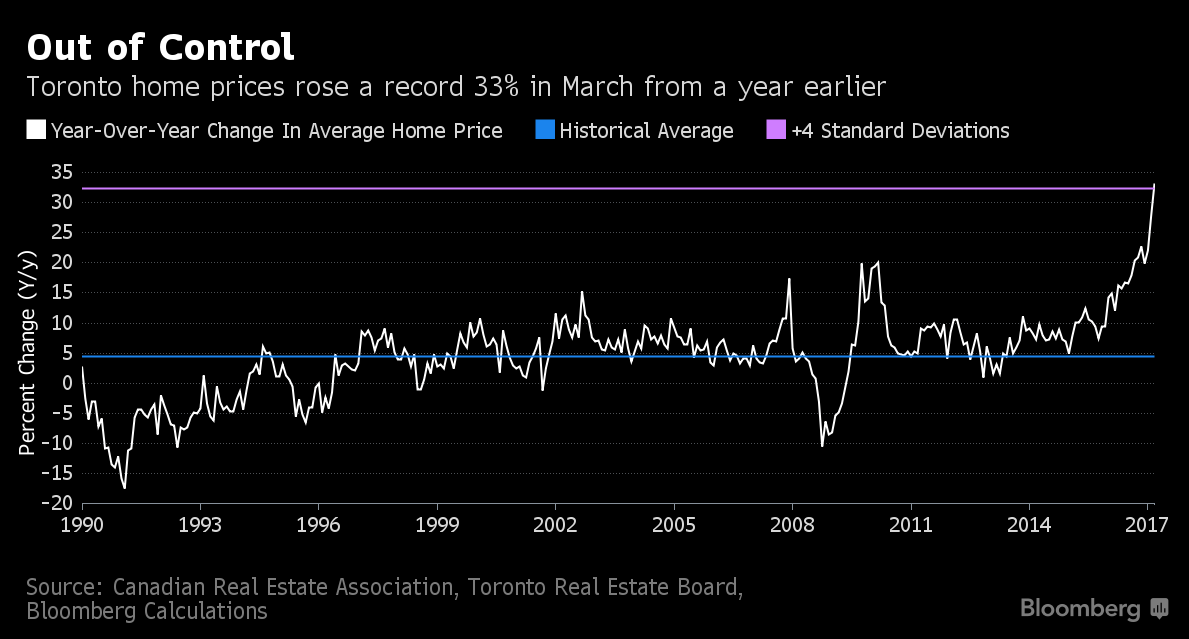
I like the graphic title: “Out of Control.” Prices are up 33%. In one year. (Notice the blue line – the ‘historic average’ price increase.) In a market where Canadian mortgage brokers are – allegedly – misrepresenting buyer incomes. At the same time, according to a report by CIBC the Canadian subprime lenders’ share of the Canadian mortgage market has reached record levels. Granted, subprime represents only 2.2% of the mortgage market today. But this is a significant increase … and may be just the beginning.
Sound familiar?
This will end badly. It’s just a matter of time. We’ve already seen the “American version” of this story. Canada seems to be repeating our mistakes. Unfortunate. Will the effects spill over to the US? Perhaps … but probably not. For two reasons. First, few US companies own Canadian mortgage debt. Second, their mortgage market is quite small by comparison to ours. At the end of 2016, total mortgages on Canadian books totaled just over $1.6 trillion. By comparison, the US mortgage market exceeded $9.7 billion. Again, I have to repeat: this will end badly. For Canada.
Let’s head south. Closer to home, we have March numbers for consumer spending and inflation. Take a look:
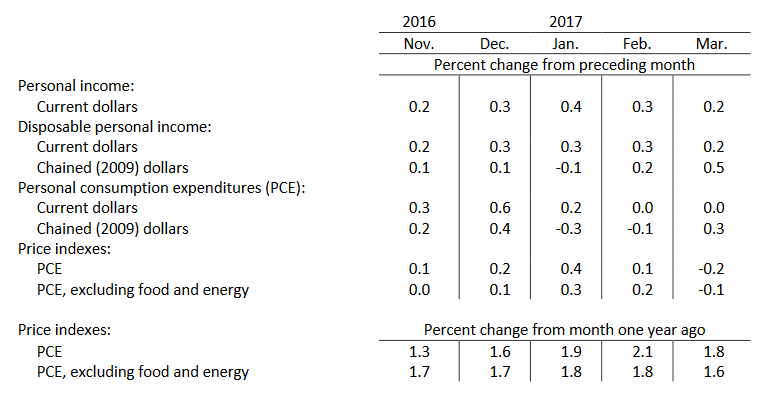
Inflation, measured by the PCE, declined slightly in March. And for the second month in a row, consumer spending – reflected by PCE – did not increase. This fact supports the weak Q1 GDP figures we saw last week. Remember, if consumer spending doesn’t increase, GDP growth will remain weak at best.
Are the steak houses telling us the same story? Let’s head over to Mastros!
Interestingly, yes, the steak houses are telling the same story. This week’s SHI reading is very different than one year ago. With a negative (-13), today’s SHI is significantly lower than the SHI on May 4th, 2016. Take a look:

Mastros Ocean Club continues its strong showing, but while a year ago Mortons had 6 booked time slots, today there are none. Until today, 2016 and 2017 SHI readings appeared to be tracking fairly closely. This week’s SHI is not. Is this meaningful? Perhaps.
The same weakening trend appears in the most recent BEA report on ‘Light Weight Vehicle Sales’. Auto sales are significant metric for consumer spending. If sales are down, this is another indicator that consumer spending is declining.
Averaging 17.9 million units per month (on an annualized basis) during 2016, vehicles sales slipped just slightly to an annual rate of 17.8 million in February; but, all the way down to 16.9 million in March and 17.2 million in April. This trend is mildly concerning.
Here is the SHI trend report since inception:

Compare 4/13/16 thru 5/4/16 to the SHI readings from similar weeks in 2017. This week, in comparison, fell off a cliff. Morton’s Bone-In Ribeye appears to have lost its allure. 🙂
Today’s FED ‘press release’ is hot off the press. Here’s their take on this topic:
“Information received since the Federal Open Market Committee met in March indicates that the labor market has continued to strengthen even as growth in economic activity slowed. Job gains were solid, on average, in recent months, and the unemployment rate declined. Household spending rose only modestly, but the fundamentals underpinning the continued growth of consumption remained solid.”
Perhaps. Let’s see how next weeks SHI compares to the May 11th, 2016 reading of negative (-3). A weakening trend may be beginning. The FED‘s comment notwithstanding.
- Terry Liebman


1 Comment
I see something really interesting about your web site so I saved to favorites.