
SHI Update 5/10/17: Flying High
SHI Update 5/03/17: Tiny Bubbles
May 3, 2017SHI Update 5/17/17: We’re Number 1!
May 17, 2017
What fuels growth in consumer spending?
Or, more importantly to us: How can our well-heeled consumer continue to spend $150 to $200 per person to enjoy aged Filet Mignon at Mortons? 🙂
Because, as you’ll see below, they continue to spend.
There are only three possible answers: Increased consumer spending is fueled by more consumers. Or by sizable pay increases across the labor force. Or by existing consumers taking on more debt. So, population growth can spur increased spending. As can large wage increases and new consumer credit.
Remember, growth in consumer spending powers US GDP growth. So we need to look to demographic trends, average hourly wages, and new debt to understand the drivers underpinning our nation’s economic growth.
Of late, population growth has been quite subdued. According to the Census Bureau, the US grew by only 0.7% in the last year. This is typical of annual growth since around 2010. In the decade before that, population grew at about 1% per year.
Wage growth, too, has been slow. Whether measured by the BEAs metric “disposable personal income” (DPI) or the BLS metric called “real earnings,” our American worker earnings growth has been sluggish for many years. Thru March 2017, the one-year change in DPI was an increase of about 2.4%, and the one-year change in ‘real average hourly earnings’ was an increase of only 0.3%.
Most folks live paycheck-to-paycheck. Even so, some of their DPI ends up in savings accounts or other investments. All disposable income is not spent. What, then, is fueling consumer spending growth?
Credit is the answer. The FEDs “Consumer Credit – G.19” report released each month tells the story. And the numbers are extraordinary. For a few reasons. Below, let’s look at the numbers and do some math.
Welcome to this week’s Steak House Index update.
As always, if you need a refresher on the SHI, or its objective and methodology, I suggest you open and read the original BLOG: https://terryliebman.wordpress.com/2016/03/02/move-over-big-mac-index-here-comes-the-steak-house-index/)
Why You Should Care: The US economy and US dollar are the bedrock of the world’s economy. This has been true for decades…and notwithstanding plenty of predictions to the contrary, it will continue to play this role for years to come. Fear not.
Nominal global GDP is about $76 trillion. US GDP is almost $19 trillion. Is it growing or shrinking? If it’s growing … how rapidly? How might this information impact our daily financial and business decisions?
The objective of the SHI is simple: To predict the GDP direction ahead of official economic releases. While the objective is simple, the task is not. BEA publishes GDP figures the instant they’re available. Unfortunately, the data is old, old news; it’s a lagging indicator.
‘Personal consumption expenditures,’ or PCE, is the single largest component of the GDP. In fact, the majority of all US GDP increases (or declines) usually result from (increases or decreases in) consumer spending. Thus, this is clearly an important metric to track.
I intend the SHI is to be predictive, anticipating where the economy is going – not where it’s been. Thereby giving us the ability to take action early. Not when it’s too late.
Taking action: Keep up with this weekly BLOG update. If the SHI index moves appreciably – either showing massive improvement or significant declines – indicating expanding economic strength or a potential recession, we’ll discuss possible actions at that time.
The BLOG: There are two categories of consumer credit: Revolving and non-revolving. Revolving is typically variable rate, variable payment. Non-revolving would be the opposite; like a fixed-rate car loan. Consumer credit does not include real estate debt.
In the past 5 years, the rate of growth in consumer credit has been extraordinary. Unlike population or wages, consumer credit has been growing rapidly. In fact, consumer credit growth has exceeded 6% per year, on the average, since 2012. Five years ago, US consumers owed about $845 billion in revolving debt. And a little over $2 trillion in non-revolving debt.
Today the numbers are closer to $1 trillion revolving and over $2.8 trillion, non-revolving. In just 5 years, US consumers took on $900 billion in new debt. And spent it all.
Apparently, these days, it’s easier to borrow money than get a pay-raise. Or, perhaps, because it’s easier to get a new car loan or credit card, people are not demanding a pay-raise. Perhaps.
Which may help explain why the low 4.4% unemployment rate, and tight labor market, isn’t translating into runaway wage inflation. (To you Econ Geeks out there, yes, I’m talking specifically about the Phillips Curve. I also addressed this topic in my recent blog, “Chickens and Eggs”. Here’s that URL: http://wp.me/p8f7f1-NH)
Many highly respected economists are concerned this may change soon. I’m not. Data for the preceding 25 years shows no meaningful correlation between inflation and the unemployment rate. (Again, re-read the “Chickens and Eggs” BLOG for a refresher.)
Take a look at this chart, courtesy of Moody’s Analytics:
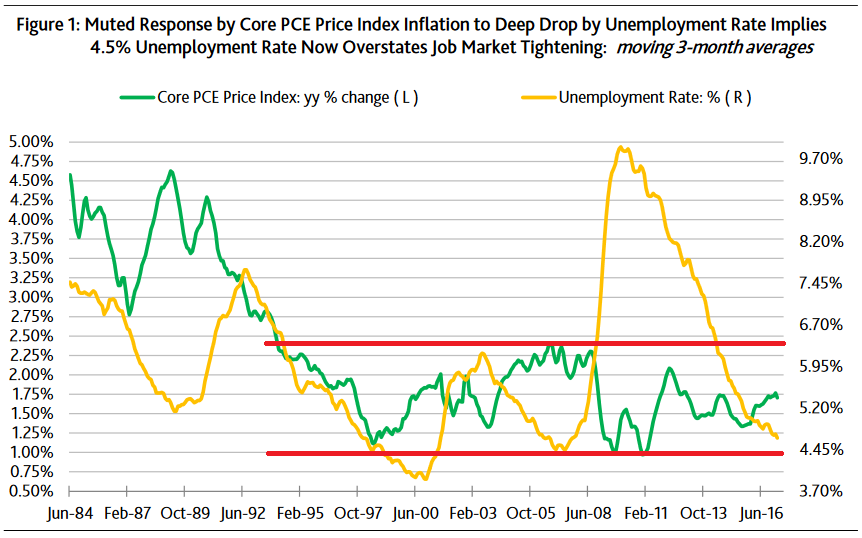
I added the two red lines. The top of the range is about 2.4% and 1% at the bottom Look at the green line: Since the early 1990s, the core PCE inflation has remained within this range. This relationship has held for 25 years. For decades now, whether the unemployment rate was 10% or 4%, or somewhere in between, core PCE inflation has been range bound.
I believe a lower unemployment rate is no longer correlated with a significant increase in price inflation. In fact, today, the opposite is sometimes true: consumer price inflation can slow in spite of a lower jobless rate. This outcome is not unusual in other advanced economies. Look at both Japan and Germany.
On a slightly different topic, it’s interesting to note the core CPI – the other, more publicly-known inflation metric – has recently been skewed higher by housing costs.
For example, March’s 2.0% annual rate of core CPI actually slowed to 1.0% after excluding a 3.5% annual jump in ‘shelter costs’ – responsible for 42% of core CPI. Of course, I can’s simply exclude components of the CPI just because they don’t support my larger theory. But housing cost increases have been largely driven by a one-time event – the Great Recession and the resultant rental housing shortage. The shortage is now corrected. It’s likely apartment rents will begin to fall as the supply/demand relationship comes more into balance in the next year or so.
Let me summarize before we move to my favorite subject: STEAKS!
My concern is this: New consumer credit has fueled consumer spending for the past 5 years. Not wage growth. Not population growth. Non-revolving debt, the larger category, tends to be used to purchase ‘durable goods‘ – products with a useful life exceeding 3 years. Things like cars and refrigerators.
And I think this debt cycle is growing long in the tooth. In part, the FED is responsible. Their three (3) short-rate increases, of 0.25% each, were intended to “cool” economic activity. They have done their job.
FED rate bumps instantly increase the cost of carrying existing consumer debt. The FED impact is felt less in non-revolving debt; much greater in revolving. Lets do the math.
The FEDs G.19 report tells us revolving (credit card) rates were about 11.8% in 2014. Today, they average about 12.5% – almost a 70 basis point increase. Meaning the aggregate cost to the American consumer, to carry this $1 trillion of revolving debt, is about $7 billion higher, each year, than 2 years ago. The annual cost to carry non-revolving debt has has increased about the same. In total, the consumer is now spending almost $15 billion per year more of interest. Add to that pile the recent 50 basis point increase in home loan rates and our poor consumer is being stretched.
FED interest rate increases make a difference. Every 25-basis point jump quickly makes its way to the consumer’s wallet – and not in a good way. As a direct result, consumers are less willing (and less able) to take on debt. Which means they have less money to spend. Causing consumer spending to slow.
The FED knows this. It is one of the intended consequences of rate increases.
Unfortunately for our embattled consumer, I don’t believe they will see meaningful aggregate wage growth in spite of our low unemployment rate. Without it, and without significant new increases consumer debt, the consumer spending growth rate may slow a bit further. Thereby keeping a lid on GDP growth. This changing trend may be what’s behind the recent slowdown in auto sales. Despite deep discounting, sales continue to trend down.
All right, it’s time to head to Ruths’ Chris and see if my concern holds water.
Nope. Not yet, anyway. Our pricey eateries are still showing copious reservations. I guess credit cards haven’t been maxed out yet. 🙂
As you can see below, your party of 4 is not eating at Mastros this Saturday evening. And – believe it or not – you won’t be eating at the Capital Grille at 6:30!

This week, our SHI reading is a positive 6. One year ago, it was almost identical. We see no appreciable change in behavior. Here is our long-term trend:

In summary, the SHI doesn’t yet show any consumer spending weakness. This notwithstanding, the credit growth deceleration is a bit concerning – at least for it’s potential impact on future consumer spending. And it’s potential adverse impact on our GDP growth rate.
We will continue to watch and see if these gathering storm clouds become more threatening. Thanks for following the SHI.
- Terry Liebman


9 Comments
What’s up friends, good piece of writing and nice urging commented here, I am actually enjoying by these.
Just desire to say your article is as astonishing. The clearness in your post is simply great and i could assume you are an expert on this subject. Fine with your permission allow me to grab your RSS feed to keep updated with forthcoming post. Thanks a million and please carry on the rewarding work.
I’m gone to inform my little brother, that he should also pay a quick visit this website on regular basis to obtain updated from most recent news update.
Greetings from Los angeles! I’m bored at work so I decided to check out your website on my iphone during lunch break. I enjoy the knowledge you present here and can’t wait to take a look when I get home. I’m amazed at how fast your blog loaded on my phone .. I’m not even using WIFI, just 3G .. Anyways, good blog!
Hi there colleagues, pleasant post and fastidious arguments commented at this place, I am genuinely enjoying by these.
Wow, marvelous weblog format! How long have you been running a blog for? you make running a blog look easy. The entire look of your web site is wonderful, let alone the content!
It is not my first time to pay a visit this web site, i am visiting this web page dailly and take good facts from here daily.
Great write-up, I am normal visitor of one’s blog, maintain up the excellent operate, and It’s going to be a regular visitor for a long time.
[…] In her press conference earlier today, Janet Yellen commented: “Policy is not on a pre-set course.” Meaning, the FED adapts their policy decisions based on evolving business and economic conditions. But make no mistake: EVERY single FED rate increase DIRECTLY and immediately impacts millions of Americans. Long-term rates may be unaffected (or less affected), but the credit cards, home loans, student loans, etc., all tied to variable, short-term indices will increase in rate by 25 basis points today or in the very near future. Life just got more expensive for millions of folks. (I talked about this issue more extensively in a prior blog: https://www.steakhouseindex.com/shi-update-51017-flying-high/) […]