
SHI 09.19.18 One Thing is Certain …

SHI 09.12.18 Ratatouille
September 12, 2018
SHI 09.26.18 Hot as Blue Blazes!
September 26, 2018
“… And that’s the fact that economic projections are inherently uncertain.”
… At least, that’s what the Congressional Budget Office (CBO) tells us on page 14 of their report entitled “An Update to the Economic Outlook: 2018 to 2028.” They go on to say:
“But CBO’s current economic projections are especially so because they incorporate several estimates of the effects of recent changes to fiscal policy, which are themselves very uncertain. In addition, recently implemented changes to trade policies, and proposals calling for further changes, compound the uncertainty surrounding the current economic outlook.”
Which begs the question, why make forecasts at all?
Welcome to this week’s Steak House Index update.
If you are new to my blog, or you need a refresher on the SHI10, or its objective and methodology, I suggest you open and read the original BLOG: https://www.steakhouseindex.com/move-over-big-mac-index-here-comes-the-steak-house-index/
Why You Should Care: The US economy and US dollar are the bedrock of the world’s economy. This has been the case for decades … and will continue to be true for years to come.
Is the US economy expanding or contracting?
According to the IMF (the ‘International Monetary Fund’), the world’s annual GDP is about $80 trillion today. US ‘current dollar’ GDP now exceeds $20.4 trillion. In Q2 of 2018, We remain about 25% of global GDP. Other than China — a distant second at around $11 trillion — the GDP of no other country is close.
The objective of the SHI10 and this blog is simple: To predict US GDP movement ahead of official economic releases — an important objective since BEA (the ‘Bureau of Economic Analysis’) gross domestic product data is outdated the day it’s released. Historically, ‘personal consumption expenditures,’ or PCE, has been the largest component of US GDP growth — typically about 2/3 of all GDP growth. In fact, the majority of all GDP increases (or declines) usually results from (increases or decreases in) consumer spending. Consumer spending is clearly a critical financial metric. In all likelihood, the most important financial metric. The Steak House Index focuses right here … on the “consumer spending” metric. I intend the SHI10 is to be predictive, anticipating where the economy is going – not where it’s been.
Taking action: Keep up with this weekly BLOG update. Not only will we cover the SHI and SHI10, but we’ll explore related items of economic importance.
If the SHI10 index moves appreciably -– either showing massive improvement or significant declines –- indicating growing economic strength or a potential recession, we’ll discuss possible actions at that time.
The BLOG:
I’ll go one step further: The CBO forecast is not ‘uncertain.’ It’s flat-out wrong. Here’s why. Take a look at this graph, taken from page 2 of the CBO report:
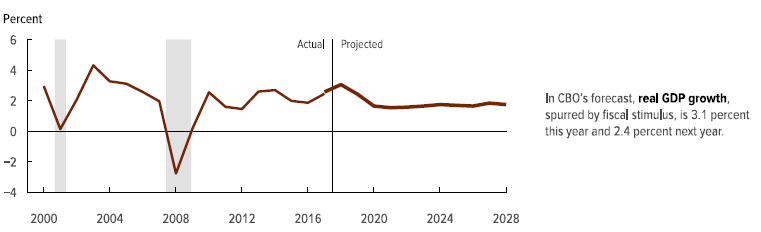
Do you see the forecasted recession? No? That’s because there isn’t one. According to the CBO, the US economy won’t see a contraction at any time during the next 10 years. The 2008 recession is clear. Our economy contracted significantly. And the very brief slowdown back in 2000 is shown. But the CBO does not forecast a recession in any year from now thru 2028.
Which is why their forecast is wrong. Here’s their forecast for GDP and inflation thru 2028:
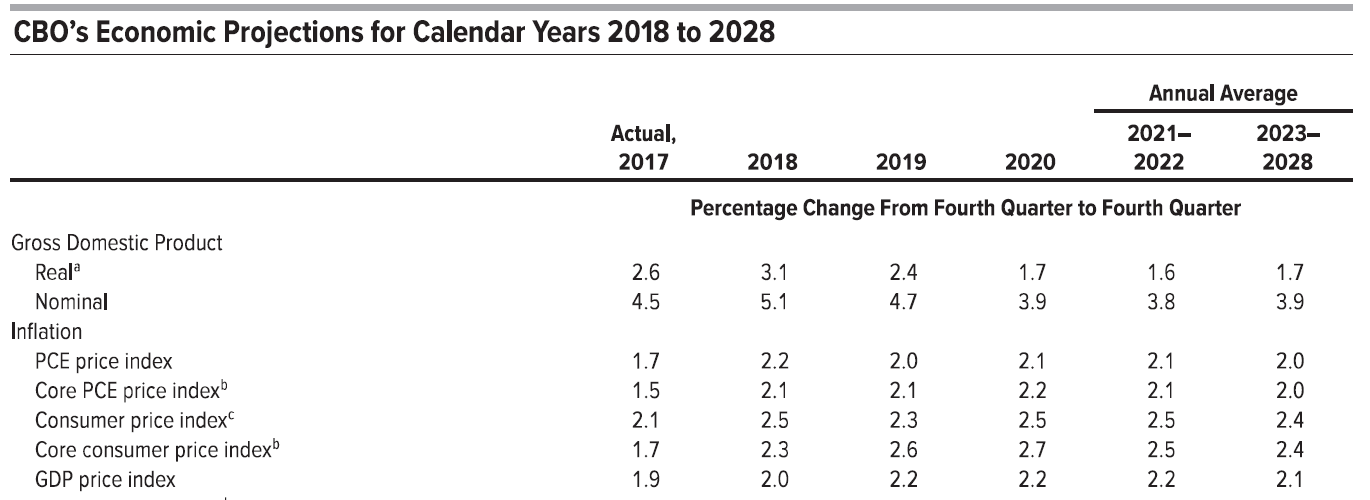
It’s entirely possible GDP growth will average 1.6 to 1.7% from 2020 to 2028. But it’s more likely we’ll see an economic contraction sometime during this period. I also find their inflation forecast interesting. It lines up quite well with the FEDs inflation forecast. Is that a coincidence? Or …. ?
So when will we see that economic contraction? Drum roll please ……………………………….
The next recession will begin within 2 years.
Why? I believe the signs are already showing up. For example, in the housing markets.
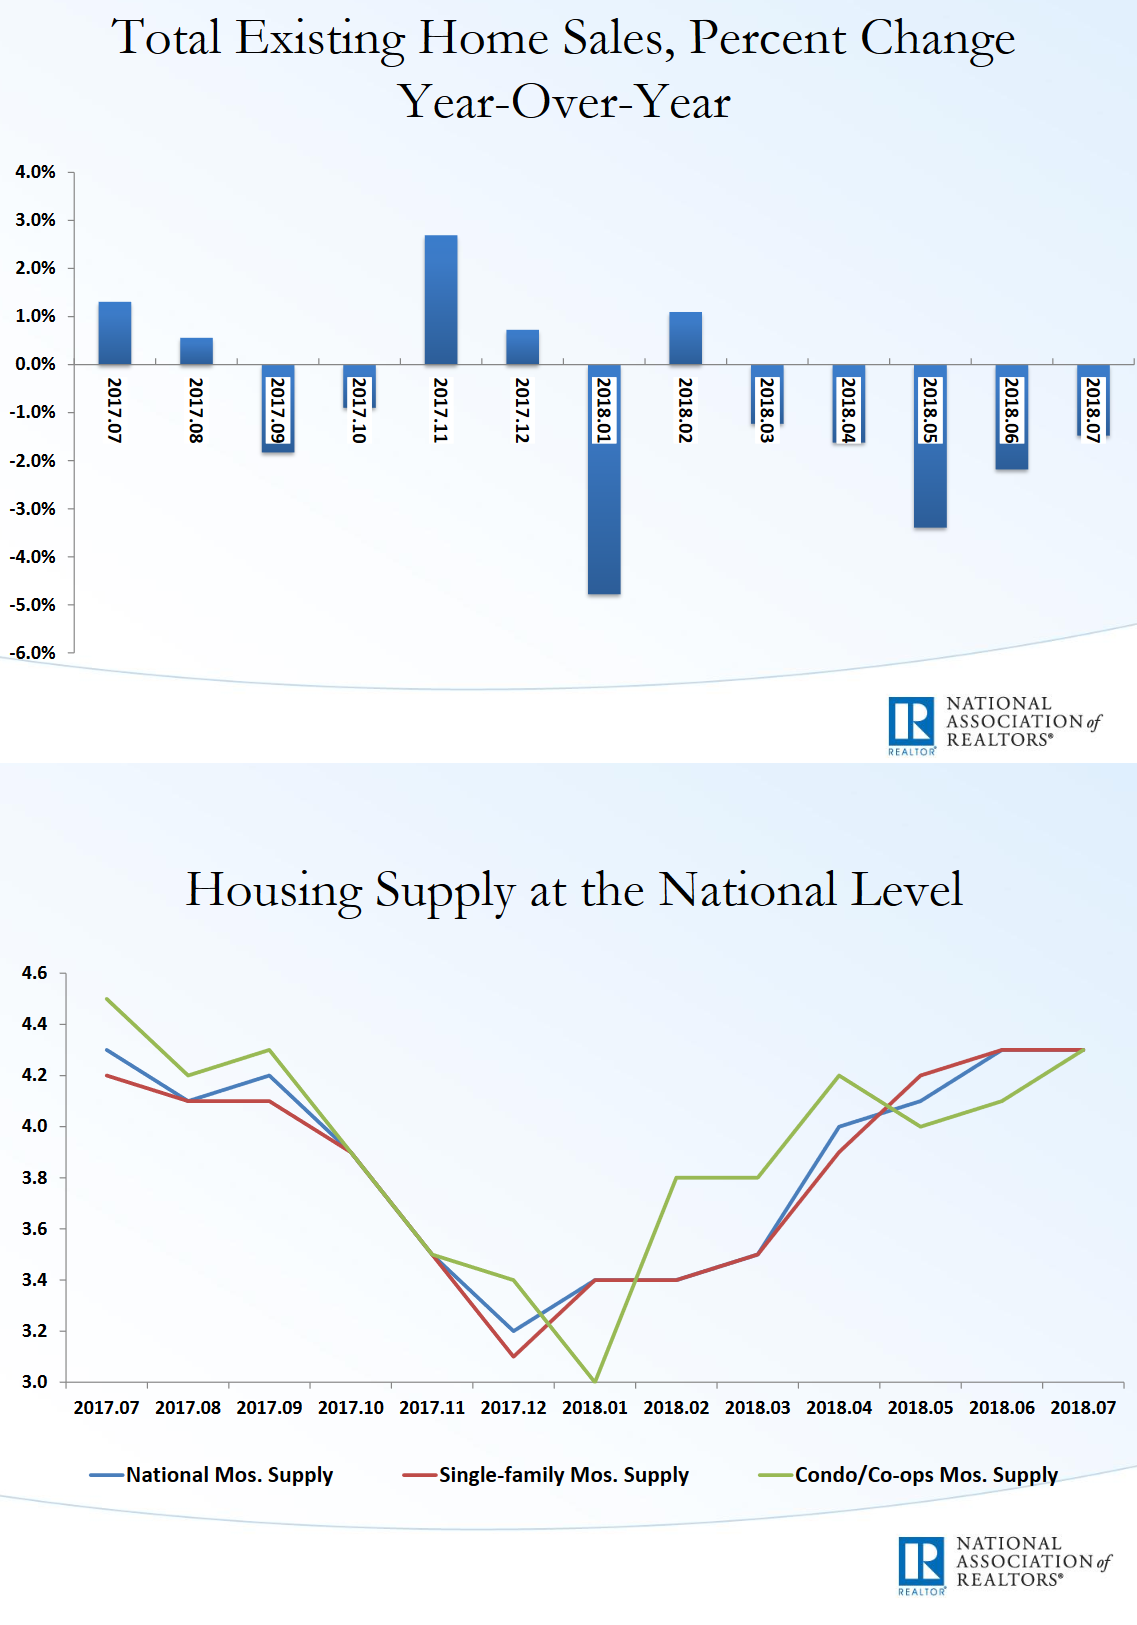
Here are a pair of charts from the National Association of Realtors, the group that carefully tracks ‘existing home sales’ statistics.
As you can see, existing home sales have been slowing consistently since March of this year. At the same time, in the second chart, we see the number of houses ‘for sale’ has been growing significantly since January of 2018. These are both bad signs.
According the the National Association of Home Builders, “housing’s share of the GDP” is 15.4%. A component called ‘residential fixed investment’ — which includes things like home remodeling, new home construction, brokerage commissions, etc., is a smaller number — about 3.5% of the total economy.
Of course, this could simply be a “pause” in what’s otherwise been a smoldering hot residential market? To be clear, the US still has a housing shortage. But, no, I don’t think this is a pause. I think it’s a directional change.
There are other signs, too.
The potential inverted yield curve which may be caused by FED tightening. The elevated levels of individual and corporate debt. The elevated levels of sovereign debt of most of the developed nations. And, of course, we are seeing an increasing threat of an extended a US/China tradewar.
Could the threat of one or more of these future events be a ‘second order chaos’ event, as Yuval Harari points out in his book, Sapiens — effectively a self-fulfilling prophesy — ultimately caused by the prediction alone?
Possibly. Or the economic slowdown might be the result of something not yet on the radar. My prediction is based not on any one event or cause, but more by the pressing weight of the collective headwinds. Remember: Economic expansions don’t die from old age. They die because something changes. Drastically. But they also die because of the excesses that build up during the expansion. And this is what I think might be happening now.
What’s my prediction worth? About as much as the CBOs. Nothing. I’m probably wrong too. 🙂
To the steakhouses!
It’s a bit eerie: This week the SHI10 fell by almost 100 points. It’s almost like steak-lovers across the country read my blog — before I even wrote it! But, of course, that couldn’t happen. Or could it? Hmmm…I’ll have to read up a bit more on quantum physics. Or ask Bill Baldwin.
Almost 30 points of that decline took place here in Orange County. And almost every other city also saw a reduction in pricey restaurant reservation demand. Here is the trend chart:
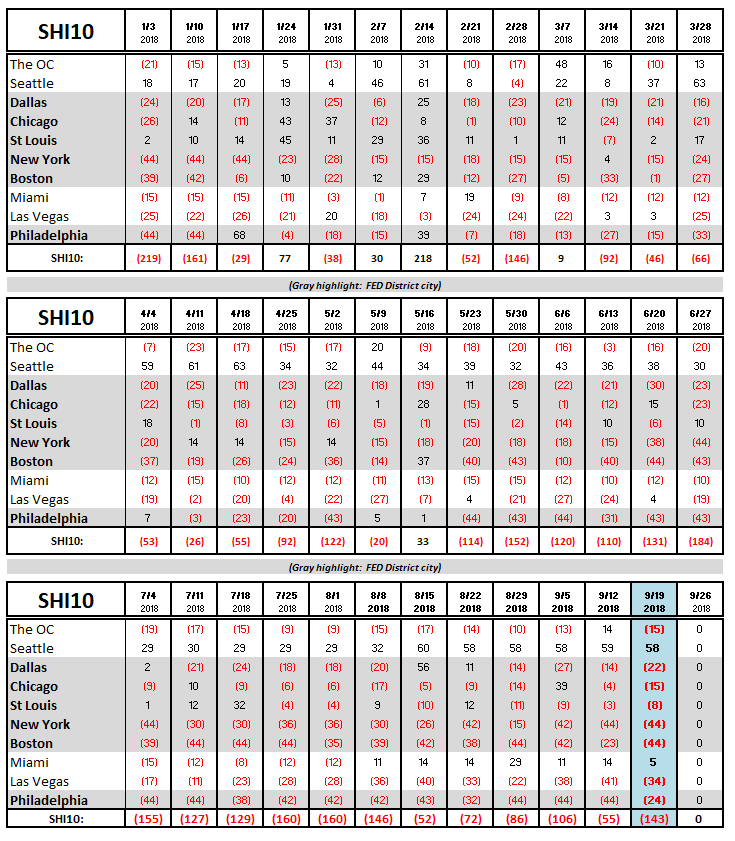
To be clear, an SHI reading of negative 143 isn’t horrible. But after seeing several weeks of an improving demand trend, this is a bit disturbing. One week does not a trend make. To be sure. But it is troublesome.
Here’s this weeks SHI chart:
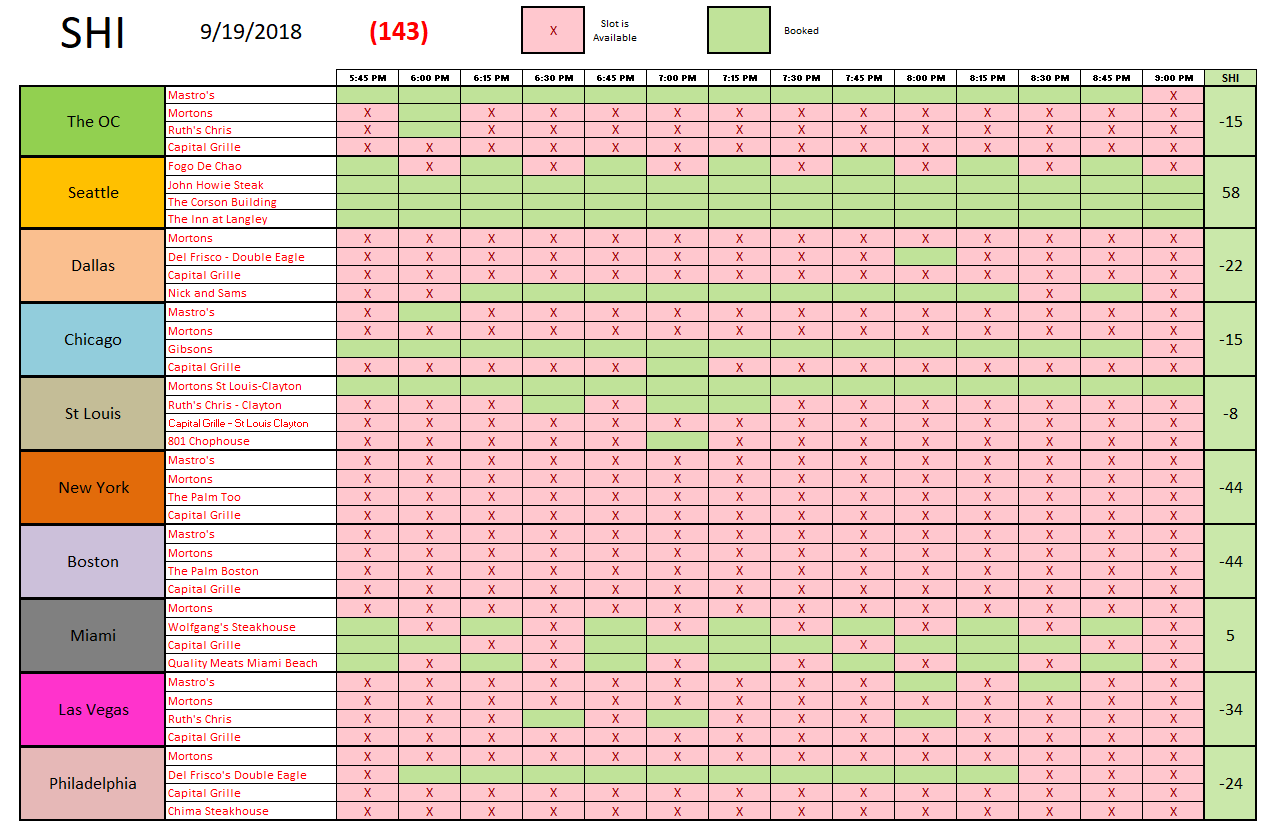
Seattle remains a bright spot in an otherwise somewhat dismal picture. Expensive steak house reservation demand is exceptionally weak in New York and Boston. And reservation demand in the other cities in our SHI10 is all over the map. I certainly don’t see much strength here.
Remember, the SHI is a proxy for the ‘consumer consumption‘ component of the GDP. We’re using the demand for expensive Filet Mignons as a barometer for future economic growth. A tasty approach, to be sure. This week, the barometer is telling us the economy is simply chugging along.
Well, we’ll see what next week brings.
– Terry Liebman


1 Comment
test