
SHI 6.22.22 – We Are Not Alone!

SHI 6.8.22 – Where Did You Go?
June 8, 2022
SHI 6.29.22 – $22 in 2022
June 29, 2022
First, an apology: I am sorry I failed to “blog” last week.
I was busy drinking and driving. No, not simultaneously. First, I was drinking. Later, I was driving. My wife and I were on a road trip to Napa and we decided to extend an extra day … putting me home late on Wednesday, far beyond the time to access SHI data and/or compose the blog. Sorry.
OK, moving on. Notwithstanding the 3-eyed image above, today’s blog has absolutely nothing to do with aliens of any type. No, today I’m focus once again on interest rates — my favorite topic! 🙂
In the present case, “we” refers to the United States. And when I say “we” are not alone, I’m pointing out that our central bank — the Federal Reserve — is just one of 45 central banks in 45 countries that have raised interest rates so far in 2022 in an effort to slow their economy and battle high inflation. Let me repeat:
“
45 central banks have raised rates in 2022.”
“45 central banks have raised rates in 2022.”
Are you surprised by the sheer size of that number? I certainly was — the uniformity of the timing, perhaps, more than the number, surprised me. But then, consider this fact: The Bank for International Settlements — effectively the “central bank” for central banks — has 63 member central banks, representing countries from around the globe that account for about 95% of the world’s GDP. I’ve talked about the Bank for International Settlements — BIS for short — in past blogs. Who are they? (Right click, open in new tab.)
https://www.bis.org/about/index.htm?m=1001
Thus, said another way, the vast majority of central banks, representing the vast majority of global GDP, have already raised short-term rates in 2022. Those who have not are likely to follow suit shortly. So here’s a question for you — the question du joir, so to speak — that we’ll cover in today’s blog:
Is the era of cheap money over?
Are interest rates heading up … and staying up for the foreseeable future? And will they remain there — at a much higher, quite elevated level?
Welcome to this week’s Steak House Index update.
If you are new to my blog, or you need a refresher on the SHI10, or its objective and methodology, I suggest you open and read the original BLOG: https://www.steakhouseindex.com/move-over-big-mac-index-here-comes-the-steak-house-index/
Why You Should Care: The US economy and US dollar are the bedrock of the world’s economy.
But is the US economy expanding or contracting?
Expanding. Significantly. By the end of Q1, 2022, in ‘current-dollar’ terms US annual economic output clocked in at $24.38 trillion. Yes, during Q1, the current-dollar GDP increased at the annualized rate of 6.5%. The world’s annual GDP rose to about $95 trillion at the end of 2021. America’s GDP remains around 25% of all global GDP. Collectively, the US, the euro zone, and China still generate about 70% of the global economic output. These are the big, global players.
The objective of this blog is singular.
It attempts to predict the direction of our GDP ahead of official economic releases. Historically, ‘personal consumption expenditures,’ or PCE, has been the largest component of US GDP growth — typically about 2/3 of all GDP growth. In fact, the majority of all GDP increases (or declines) usually results from (increases or decreases in) consumer spending. Consumer spending is clearly a critical financial metric. In all likelihood, the most important financial metric. The Steak House Index focuses right here … on the “consumer spending” metric. I intend the SHI10 is to be predictive, anticipating where the economy is going – not where it’s been.
Taking action: Keep up with this weekly BLOG update. Not only will we cover the SHI and SHI10, but we’ll explore “fun” items of economic importance. Hopefully you find the discussion fun, too.
If the SHI10 index moves appreciably -– either showing massive improvement or significant declines –- indicating growing economic strength or a potential recession, we’ll discuss possible actions at that time.
The Blog:
Nope. I don’t think so.
Notwithstanding the fact that just about every large central bank is now raising rates, I continue to believe this is simply a short-term detour from the larger, longer-term economic trend — a world filled with lots of money, fewer young people, and consistently low long-term interest rates. Let me explain.
But first, take a look at this fascinating graphic:
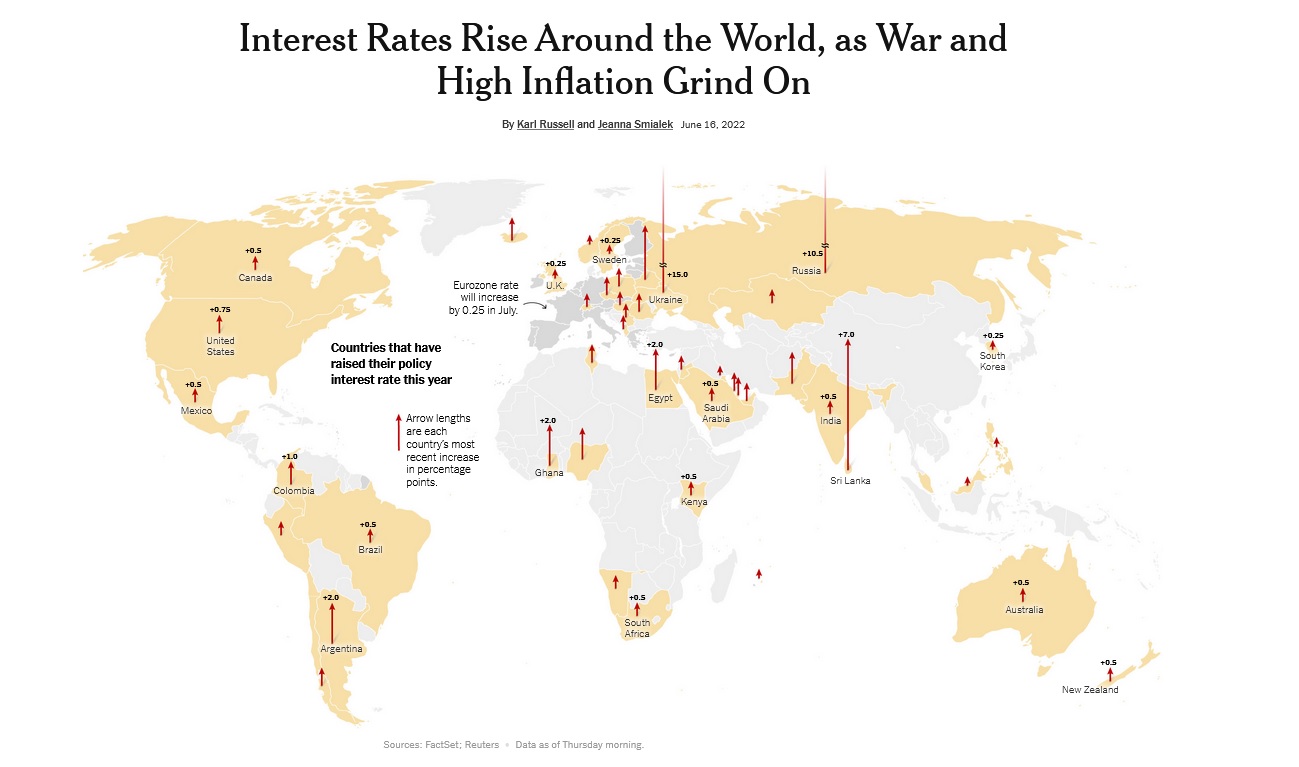
Only Africa, the middle east and China have left rates unchanged. Even the EU with a current negative “policy rate” plans to increase short-term rates in July. In fact, the only “major” economy in the world that has not yet raised, or pledge to raise, short-term interest rates is Japan. But that’s another story for another day.
So, we are not alone. Almost every advanced economy on the planet is now wrestling with higher interest rates. Are higher rates the “New Normal?” Is the era of cheap money dead and gone … and we should expect moderate to high interest rates from here on out?
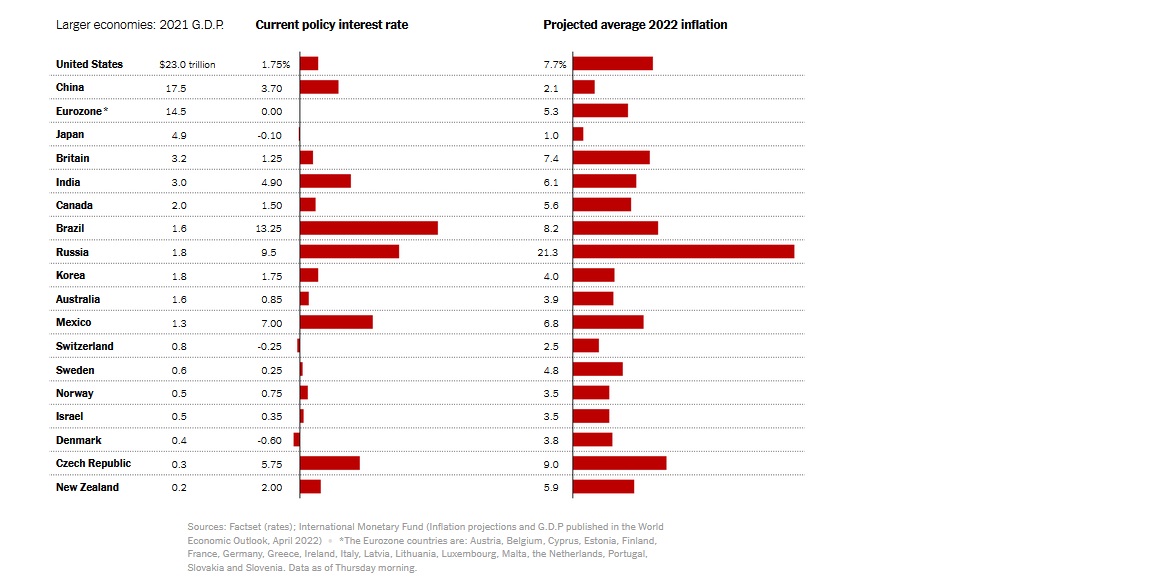
No. I don’t believe that’s the future. Sure, compared to the past 5 or so years, rates are high right now. But today’s rates are the direct result of central bank policy responses focused on anchoring household inflation expectations in the face the inflation shocks every major economy is now experiencing. Even Japan, where deflation has been more common than inflation over the past few decades, is experiencing inflation above 2% right now. Inflation is ubiquitous around the globe … and rates are rising:
So you may be wondering why I’m so steadfast in my believe that this episode is only a short-term aberration in the longer-term story? Why am I predicting long-term rates will decline to the exceptionally low levels we saw over the past ten or so years?
I believe the story is as much demographic as it is economic. Consider this graph, courtesy of FRED, reflecting an “index” value for HOUSEHOLD NET WORTH (left hand side) overlaid against the “index” value for the “10-YEAR REAL INTEREST RATE” (right hand side), over the past 35 or so years:
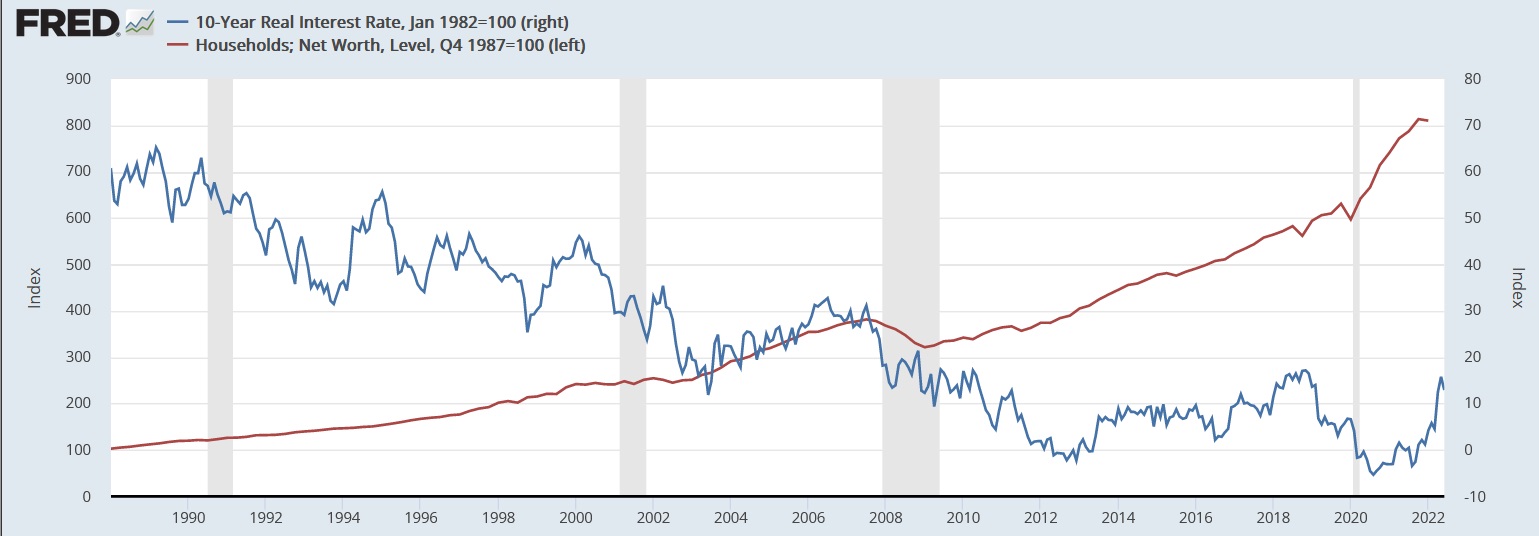
The chart above highlights two events that happened nearly simultaneously.
THE BLUE LINE: For the past 35 or so years, “real” interest rates have fallen continuously. Remember that the “real” 10-year yield is the rate of return a 10-year investor can hope to receive, after removing the effects of inflation. THE RED LINE: At the same time, the “net worth” of American households increased almost 8X. The increase in just the past 10-years is equally staggering: In 2012, the FED calculated America’s aggregate net worth at just under $72 trillion; today, they calculate the number to be ALMOST $150 TRILLION !
In early 2005, the then-FED chairman, Ben Bernanke, described a growing “global savings glut” that dwarfed all historic numbers. In a speech around that time, Bernanke commented on both the savings glut and the evolving demographic picture:
“I will argue that over the past decade a combination of diverse forces has created a significant increase in the global supply of saving–a global saving glut–which helps to explain both the increase in the U.S. current account deficit and the relatively low level of long-term real interest rates in the world today. The prospect of dramatic increases in the ratio of retirees to workers in a number of major industrial economies is one important reason for the high level of global saving. However, as I will discuss, a particularly interesting aspect of the global saving glut has been a remarkable reversal in the flows of credit to developing and emerging-market economies, a shift that has transformed those economies from borrowers on international capital markets to large net lenders.”
A savings glut. More retirees. Both are even more true today — 17 years after his infamous speech (right click, open new tab).
https://www.federalreserve.gov/boarddocs/speeches/2005/200503102/
In 2006, the International Monetary Fund published a report that highlighted, “… companies in many industrial countries have moved from their traditional position of borrowing funds to finance their capital expenditures to running financial surpluses that they are now lending to other sectors of the economy.“
I can go on, and on, and on, but suffice it to say that all that “cash” is looking for a return. At the same time, businesses in developed economies — in the aggregate — have maintained a lower level of capital expenditures that in years before. For the past 40 years, “CAP EX” has grown about 5% per year over the prior year. In the 35 years preceding that — from around 1948 to 1982, the annual growth rate for CAP EX exceeded 8.8%. For decades, companies invested in fewer “plants and equipment” probably, again, do to an aging population, changing demographics and a slower-growth working-age population. The even “worse” news news is the fact that these demographic trends continue to accelerate.
THE BOTTOM LINE IS THIS: The savings glut is still growing. At the same time, investment opportunities are, at best, static. In my opinion, frankly, they are shrinking in lockstep with the aging population in developed nations. This is another perfect example of the “supply vs. demand” paradigm. As the supply of capital grows, and the opportunity to find investment yields at best remains flat, yields must fall over time. This is a long, LONG, LONG term trend … current FED behavior is not.
For years, you’ve heard me say “correlation does not mean causation.” That holds true today as always. However, this truism does not suggest that correlation and causation are always mutually exclusive. Sometimes, perhaps even quite often, the two are coincident. As they are in this instance and as I highlighted about 18 months ago (right click, open new tab):
https://steakhouseindex.com/shi-12-16-20-piles-and-piles-of-cash/
The FED has made it patently clear they are committed to crushing today’s run-away consumer inflation, regardless of the casualties along the way. Casualties like the stock market, the bond market, the civilian labor force, and perhaps even the economy as a whole. Yes, they tell us they are perfectly willing to push the US economy into a recession if that’s what it takes to wrangle inflation back into its 2% paddock. But when they’re done, however they get there, both short- and long-term interest rates will once again head down. I believe that once inflation is “tamed,” shortly thereafter, interest rates will quickly fall. A few years from now when struggling to maintain even a 2% inflation rate, the FED may wish they treated inflation a little kinder back in 2022.
Let’s see how the steakhouses are faring this week.
The short answer is “about the same.” A few of the ten SHI markets improved, a few seemed to soften. But all in all, this weeks reading is very aligned with the past few weeks. I find it interesting that reservation demand in the OC expensive eateries is exceptionally consistent. Week over week, demand remains quite strong. It will be interesting to see how local reservation demand holds up should the FED push us over the cliff. 🙂
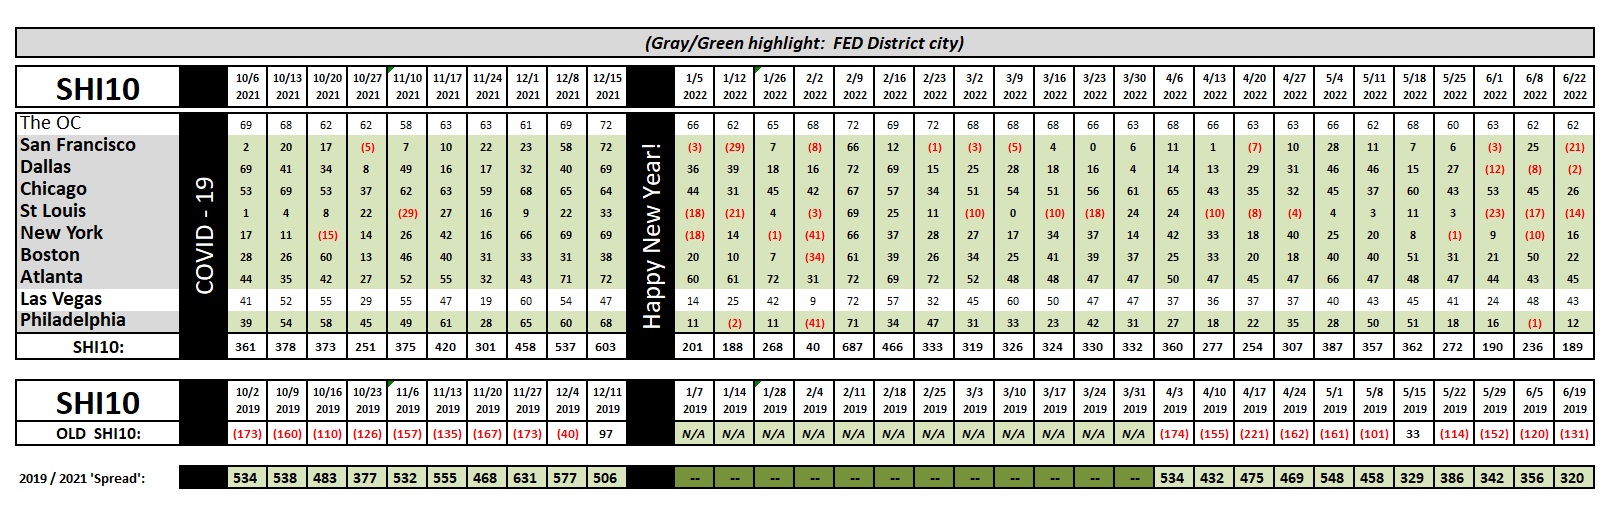
Here is the individual restaurant chart for this week:
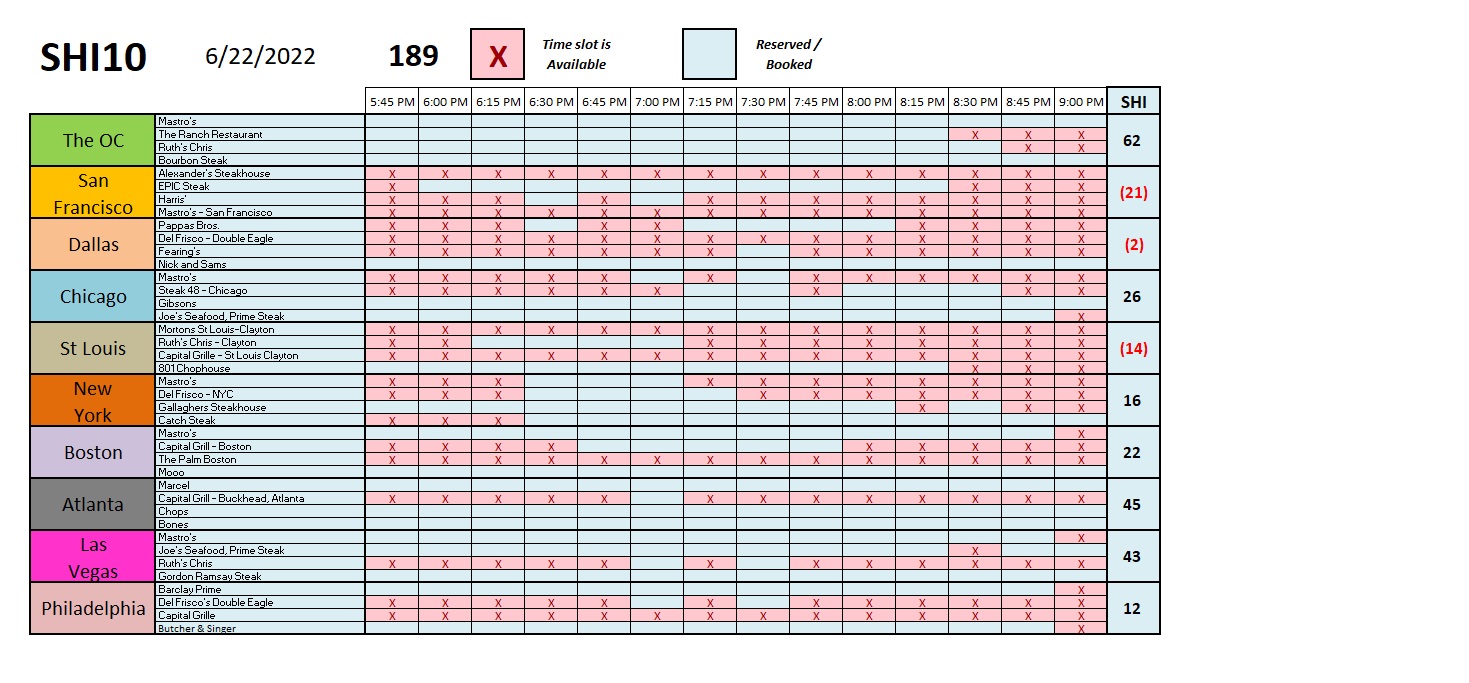 Our pricey steakhouses continue to suggest it’s a mixed-bag out there: Reservation demand in some cities is exceptionally strong, in others, quite weak. To my eyes, today’s SHI10 chart is suggesting the US economy remains on sound footing, but not consistently across all markets.
This interpretation is in alignment with many of the “professional” GDP forecasters out there, like the Atlanta FED, the NY FED, Moody’s Analytics — it’s a mixed bag. Ironically, in their “Opportunity Insights” economic tracker, the analysts over at Harvard University tell us that for the week ending June 17th, “all job postings” remain high — up more than 50.9% since the start of 2020. That is a strong read … one that surprises me a bit.
So the economy continues to chug along … in spite of the FEDs machinations. We won’t see an official Q2 GDP number for about a month. When we do, the current data suggests “real” GDP growth is likely to be quite weak — remember, that number is “deflated” and adjusted by the current inflation reading. The nominal number, on the other hand, should be reasonably strong.
Have a great week and weekend … thanks for checking in!
<:> Terry Liebman


