
SHI 9/20/17: The Great, Golden State

SHI 9/13/17: Inflation Accelerates!
September 13, 2017
SHI 9/27/17: If You Like Puzzles …
September 27, 2017
California’s GDP exceeds that of France, India and Italy.
Which is pretty darn impressive, considering we’re simply a state. Not a country. So what happens in California is important — for Californians, and the US as a whole. Making this fact fairly interesting:
Between January and August of 2017 — 2/3 of the year — California has added 124,600 new jobs.
Not bad. But this sum is significantly lower than the same period in 2016 — 70,900 jobs less, in fact. 36% fewer this year than in 2016. If one believes job growth is correlated with economic growth — and I do — then the GDP growth rate in California may well be slowing. As the California economy is over 1/8 — 13.6% in percentages — of the total US economy, this is a bit concerning.
Welcome to this week’s Steak House Index update.
If you are new to my blog, or you need a refresher on the SHI, or its objective and methodology, I suggest you open and read the original BLOG: https://www.steakhouseindex.com/move-over-big-mac-index-here-comes-the-steak-house-index/
Why You Should Care: The US economy and US dollar are the bedrock of the world’s economy. At present, is the US economy expanding or contracting? We need to know.
The world’s GDP is about $76 trillion. At last count, our ‘current dollar’ US GDP is now over $19 trillion — about 25% of the total. No other country is even close.
The objective of the SHI is simple: To help us predict US GDP movement ahead of official economic releases — important since BEA data is outdated the day they release it.
‘Personal consumption expenditures,’ or PCE, is the single largest component of US GDP — about 2/3 of the total. In fact, the majority of all US GDP increases (or declines) usually result from (increases or decreases in) consumer spending. Thus, this is clearly an important metric to track. The Steak House Index focuses right here … right on the “consumer spending” metric.
I intend the SHI is to be predictive, anticipating where the economy is going – not where it’s been. Thereby giving us the ability to take action early.
Taking action: Keep up with this weekly BLOG update.
If the SHI index moves appreciably -– either showing massive improvement or significant declines –- indicating expanding economic strength or a potential recession, we’ll discuss possible actions at that time.
The BLOG:
You’ve probably heard this before: If California was a country, it’s GDP would exceed 190 of the 195 countries in the world. That’s right: The GDPs of only 5 countries exceeds the GDP of California. No wonder they call it the “Golden State.” 🙂
Here’s a great graphic, courtesy of our friends at Forbes:
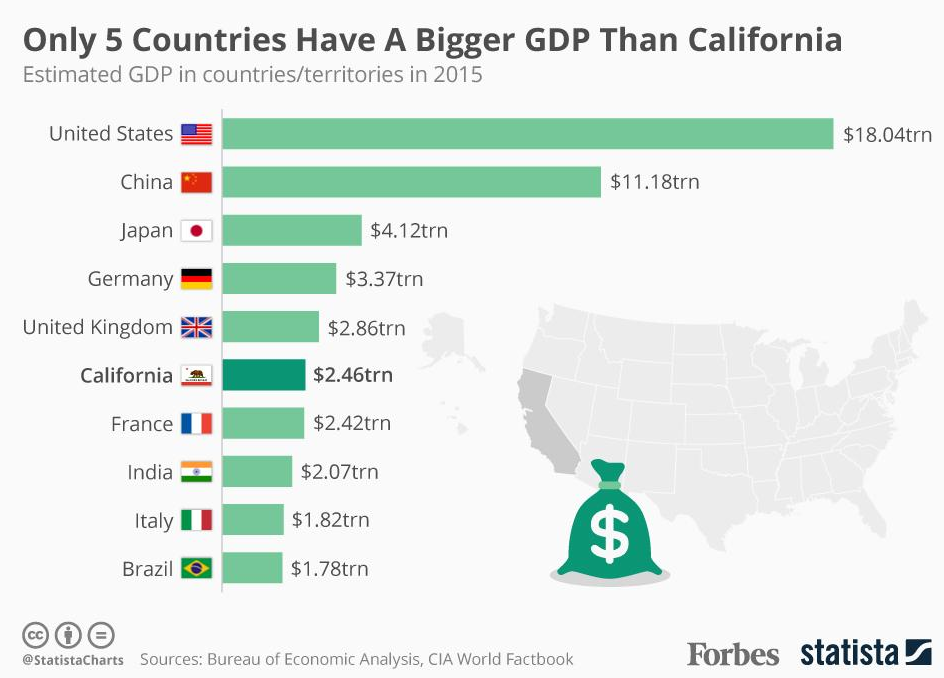
We’ve talked extensively about the US GDP…and that of China — both of which have grown meaningfully in years past. GDP growth in Japan has been, well, negative for quite some time. Its economy is shrinking. In 2012, Japan’s GDP exceeded $6 trillion. Their shrinking economy is quite interesting … but that’s another story for another time.
The GDPs of Germany and the UK — the strongest economies of the European Union — are larger than California. But not by much.
Job growth and employment levels drive GDP growth. So it’s a bit concerning when I see an image like the one below, taken from Friday’s LA Times:

The unemployment rate in California has been rising in the past few months. Job growth was actually negative in 3 of the 8 months during 2017. It appears the California economic expansion may be slowing. A bit.
The US labor force — you’ll recall it’s called the “Civilian Labor Force” — is just a bit over 160 million folks in size. Here in California, the CLF is about 19.1 million — 11.9% of the US total. Take a look at the chart below:

You may have noticed the bottom line showing the US “seasonally adjusted” unemployment rate. That rate has continue to decline and hover in the low 4s. California’s unemployment rate, however, seems to be trending up. In fact, according the the California Employment Development Department, the state lost 8,200 jobs in August.
Whether trend or aberration, California’s experience is concerning. Not because the losses are huge. And they may well improve in September. Nor, frankly, am I overly concerned this is a harbinger of a US slowdown. No, my concern is for California. These job losses — and more in the future — may be directly related to the high cost of housing: “According to the latest Berkeley IGS Poll, 48% of the state’s registered voters describe the problem of housing affordability as an “extremely serious” problem in the area where they live, and another 36% say it’s ‘somewhat serious.'”
The findings of a 9/19 Berkeley “Institute of Governmental Studies” poll of 1,200 registered California voters found the 56% of California voters polled are considering moving, 25% are thinking about relocating out of state. As you might imagine, the problem is most serious in the San Francisco bay-area and the southern California “South Coast.” But other areas are also impacted:

The bottom line here? This is a serious issue for California to grapple with. Yes, I’ve talked extensively about the importance of home-ownership. Home values have been increasing year after year — which is great for homeowners, but not renters. And the flip side of this coin is housing affordability. If homes — both owned and rented — continue to become more expensive, where will the lowest-income quartile of our 19.1 million workers live? Yes, this is a rhetorical question … but one worth pondering. Especially if the California economy losses steam because current or potential businesses and employees relocate to states where housing is actually affordable. Like Texas.
California may soon become a place where its too expensive to live … folks will only be able to visit for a short time. It’s definitely “too expensive” to “live” at our extravagant eateries. We can only visit. Though, it would be fun to try. 🙂
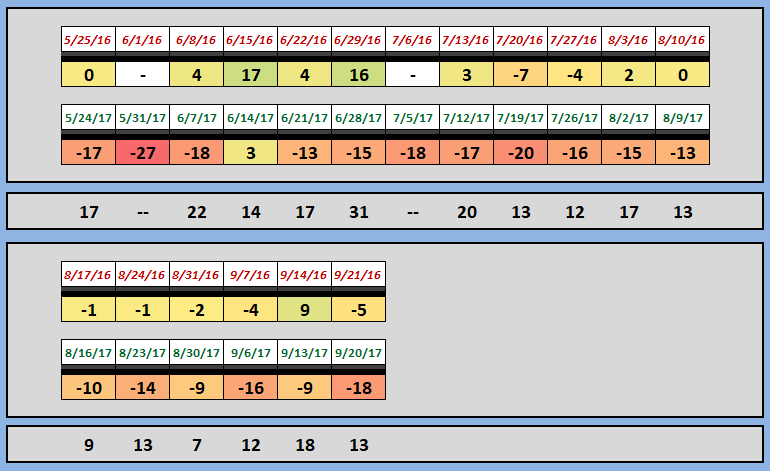
That might explain why our delectable steakhouses, too, are having trouble finding customers these days. This week’s SHI, once again, is weak:

One year ago, the SHI reading was also fairly low. But not this low. With the exception of Mastros — once again — which is only available this Saturday, for a party of 4, at 9 pm, every other table in our expensive steakhouses is wide open. Here’s the image of our longer term trend:
It’s been many months since we’ve seen a strong SHI reading. It’s been so long, you may have forgotten what a strong reading looks like. Here is the SHI image from February 8th, earlier this year, where the reading was a positive 35:
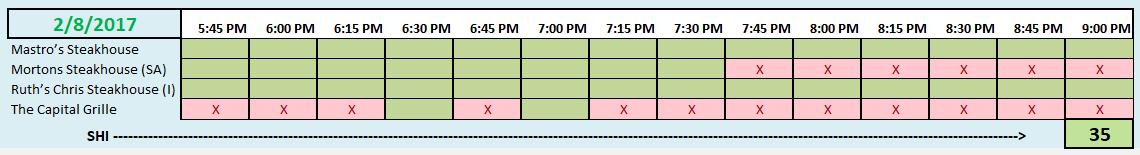
Even The Capital Grille had two booked time slots! Ruths’ Chris was fully booked and Morton’s had fewer than 1/2 its tables available. Comparing this image to today’s image, its easy to see the sizable differences.
The question remains: Are the low SHI readings meaningful? Does the dinner reservation slowdown indicate weakness in consumer spending that will translate into weaker GDP growth in the third quarter of 2017? I contend it does. Consumer spending is a reflection of choice. While our SHI may be a simplistic microcosm, if individuals and businesses are choosing to cut back on extravagant steak dinners — as the SHI suggests — I believe this behavior is a reflection of the larger picture. The SHI forecast helps us quantify these behavioral choices.
Of course, we’ll know soon enough if the SHI is predictive, or simply a tasty morsel. 🙂
- Terry Liebman


1 Comment
Great read!