SHI Update 5/24/17: The FED and the Steak House
SHI Update 5/17/17: We’re Number 1!
May 17, 2017SHI Update 5/31/17: R-Words
May 31, 2017
Will FED rate increases cause the next recession?
Generally speaking, are FED rate increases either the cause of, or predictive of, a near-term economic contraction? Have the recent FED rate increases had any impact on costly steak sales at our ritzy SHI eateries?
Let’s take a look.
Welcome to this week’s Steak House Index update.
As always, if you need a refresher on the SHI, or its objective and methodology, I suggest you open and read the original BLOG: https://terryliebman.wordpress.com/2016/03/02/move-over-big-mac-index-here-comes-the-steak-house-index/)
Why You Should Care: The US economy and US dollar are the bedrock of the world’s economy. This has been true for decades…and notwithstanding plenty of predictions to the contrary, it will continue to play this role for years to come. Fear not.
Nominal global GDP is about $76 trillion. US GDP is almost $19 trillion. Is it growing or shrinking? If it’s growing … how rapidly? How might this information impact our daily financial and business decisions?
The objective of the SHI is simple: To predict the GDP direction ahead of official economic releases. While the objective is simple, the task is not. BEA publishes GDP figures the instant they’re available. Unfortunately, the data is old, old news; it’s a lagging indicator.
‘Personal consumption expenditures,’ or PCE, is the single largest component of the GDP. In fact, the majority of all US GDP increases (or declines) usually result from (increases or decreases in) consumer spending. Thus, this is clearly an important metric to track.
I intend the SHI is to be predictive, anticipating where the economy is going – not where it’s been. Thereby giving us the ability to take action early. Not when it’s too late.
Taking action: Keep up with this weekly BLOG update. If the SHI index moves appreciably – either showing massive improvement or significant declines – indicating expanding economic strength or a potential recession, we’ll discuss possible actions at that time.
The BLOG: I often talk about the FED. For good reason: They are the proverbial 800-pound gorilla in the room — our financial safety depends on close scrutiny.
Twice a year the FED produces the “Monetary Policy Report” for the US Senate and House of Representatives. Whether they read it or not, we should. It’s chock-full of phenomenal economic commentary and analysis. Here’s the URL if you’re ready to dig in: https://www.federalreserve.gov/monetarypolicy/files/20170214_mprfullreport.pdf
Beginning on page 30 of the report, the FED makes these comments:
- Monetary policy continues to support the economic expansion
- Future changes in the federal funds rate will depending on the economic outlook as informed by incoming data
- The size of the Federal Reserve’s balance sheet has remained stable
- The Federal Reserve’s implementation of monetary policy has continued smoothly
Their discussion is worth a view.
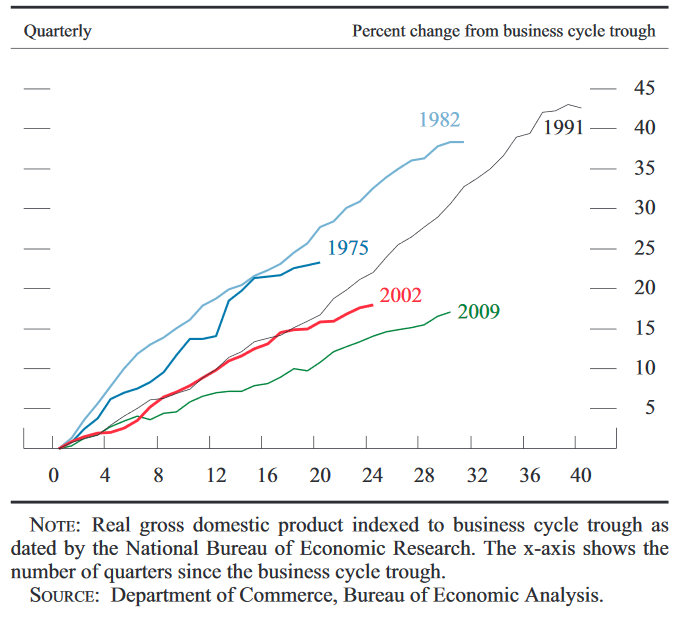
On page 6, they talk about the ongoing “…Recover from the Great Recession….” and how the pace of the current economic expansion is the weakest since WW2.

The graph measures quarterly results. The date shows the date each recover began. Almost 32 quarters into this recovery and GDP growth remains lackluster. Clearly the FED doesn’t want to jeopardize the continuing expansion, right?
Then why, pray tell, are they raising short term interest rates? As you know, the FED raised their funds rate by 1/4% in December of 2015 and 2016. And then again, on March 16th of this year. Collectively, a 75 basis point increase. Will these increases trigger a recession?
And what impact, if any, have they had on Steakonomics? Let’s start here.
Last week I mentioned I planned to reformat the SHI trend report. We now have a ‘side-by-side comparison’ of 2016 vs. 2017. The gray boxes at the top show 2016 and 2017 results – for the same week of the year. The balance of the data below shows the trend, but we don’t yet have a comparison week.
Here is thd SHI trend report:

Yes, the 5/24 SHI reading is quite weak. Coming off a strong reading last week, I’m not yet concerned. One SHI does not a trend make. But it does raise the hackles a bit.
Here is this week’s SHI report:

An SHI reading of negative (-17) is quite weak. Especially when compared to this week last year. If our pricey steak houses are an accurate barometer, the consumer spending component of our GDP may be slowing. This week last year, our expensive steakhouses were in much greater demand. But, again, one SHI does not a trend make. Let’s see how next week compares before I raise any alarms.
Can we blame this week’s SHI weakness on FED rate increases? To answer this question, let’s start at the ‘high level’, first looking at the 10-year, 3-month interest rate spread.
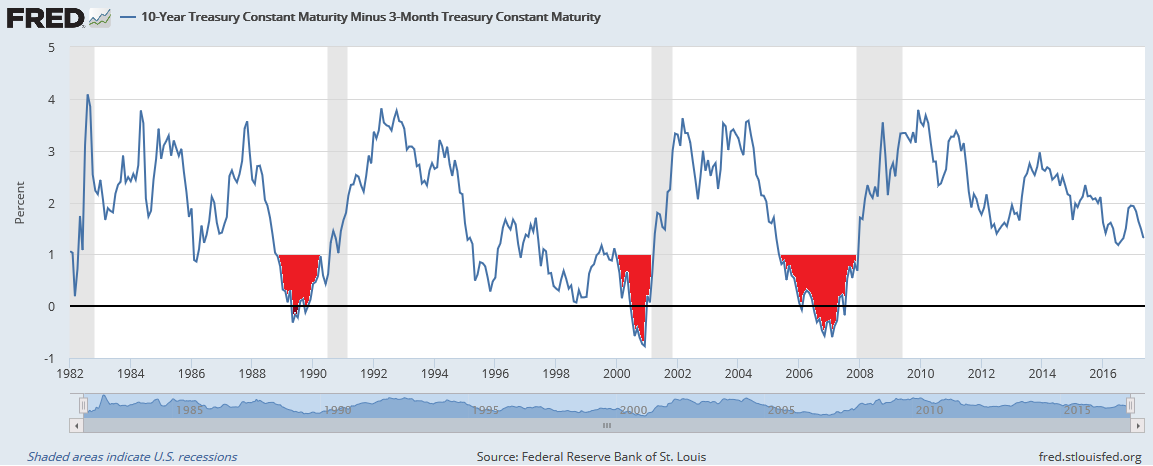
Take a look at this graphic, courtesy of the St. Louis FED:

First, I’ve modified the graphic a bit. I’ve added the red fill — from 1% and below — makes it a bit easier to see my point: Note that each of the three (3) prior recessions was preceded by a negative interest rate spread – meaning the 10-year Treasury was trading at a lower yield than the 3-month Treasury. In each case, months after the spread turned negative, the US economy entered a recession.
Now look to the far right. You can see the 10year/3-month spread remains well above 1%. Yes, it has thinned recently. And if the FED raises rates further, it may shrink again. Further, if the FED were to raise short term rates quickly and significantly, the spread can easily go negative.
This begs an interesting question: Did FED rate increases cause the yield spread to go negative preceding the three prior recessions?
Perhaps. Evidence suggests a relationship is likely. Let take a closer look at the three (3) recessions highlighted in the graph above.
On March 21, 1988 the effective FED funds rate was just over 6.5% – quite high by today’s standards. But by April of 1989, the rate was just under 10.00%. The 3%+ increase caused the red ink we see in the graph. A recession followed shortly thereafter.
The FED funds rate began 1999 at 4.75%. By May 16th, 2000, the FED had increased it 6 times up to 6.50%. That 1.75% increase caused the red ink we see in the graph. A recession followed shortly thereafter.
The FED funds rate began 2005 at 2.25%. 2005 saw eight (8) FED rate increases. By June 29th, 2006, the FED had increased four (4) additional times, peaking at 5.25%. That 3.00% increase caused the red ink we see in the graph. The “Great Recession” followed shortly thereafter.
But at other times, a FED rate increases have not preceded a recession. For example, in 1994, the FED raised from 3% to 5.5% by November 15th of that same year. No recession.
Thus, once again, we have to take a hard look at the concepts of ‘correlation‘ and ‘causation‘. Proximity, in itself, does not cause something to happen. I suspect speed of change has some impact. As does the general nature of the economy when the rate increases begin.
Said another way, if the US expansion is already ailing, showing signs of peakedness, a rapid series of rate increases seems to push us into contraction.
Regardless, one conclusion is clear: FED rate increases are definitely an indicator of potential future economic weakness. An aggressive combination of quantity and frequency can clearly push us over the edge … especially if we’re already close to that edge.
Good news: That is not the case today. Economic growth remains consistent, if somewhat muted. We are not near the edge. We’ve seen 3 rate increases from the FED, across 15 months, totaling 0.75%.
Leading up to the 3 recessions discussed above, conditions were markedly different:
- 1988: A 3.00% increase over an 18 month period.
- 2000: A 1.75% increase over an 17 month period.
- 2005: A 3.00% increase over an 18 month period.
Over about the same amount of time, recent rate increases are much lower. And the yield-spread remains quite positive.
Thus, I feel our current economic expansion is safe. For now. As always, we will continue to watch the data with vigilance, a knife, a fork, and a good steak!
- Terry Liebman


2 Comments
[…] Why does a low natural interest rate restrict FED rate increases? In last week’s SHI update, we discussed how the FED can cause the yield curve to invert. (https://www.steakhouseindex.com/shi-update-52417-the-fed-and-the-steak-house/) […]
Thank you for your blog. Much obliged.