
SHI Update 5/31/17: R-Words

SHI Update 5/24/17: The FED and the Steak House
May 24, 2017SHI Update 6/7/17: Liars Poker
June 7, 2017
The Steakhouse Index is intended to be a light-hearted proxy for ‘hard’ economic metrics….
Last week, I was enjoying a meal at an Los Angeles steakhouse with my wife and a friend. My wife ordered her steak ‘rare’, as she always does. (I’m more of a ‘medium-rare’ guy.) Our friend, on the other hand, ordered her steak <GASP!> ‘well done!’ Well done?!?! That’s veritable shoe leather! That is one hard piece of meat! A rare steak, on the other hand, is quite soft. Yes, I have a point here. 🙂
In the minutes from their March meeting, the FED talked about “hard data versus soft data.” Not steaks, in this case, but data. Per the FED, “hard data” refers to concrete, or quantitative, results, such as unemployment rates or wage increases. Alternatively, “soft data” is more qualitative, focusing more on American sentiments and beliefs about the economy.
So, before we dig our knives and forks into the soft SHI weekly metrics, and a beautifully cooked steak, let’s first cut into some ‘hard’ data.
Welcome to this week’s Steak House Index update.
As always, if you need a refresher on the SHI, or its objective and methodology, I suggest you open and read the original BLOG: https://terryliebman.wordpress.com/2016/03/02/move-over-big-mac-index-here-comes-the-steak-house-index/)
Why You Should Care: The US economy and US dollar are the bedrock of the world’s economy. Is it expanding or contracting?
Nominal global GDP is about $76 trillion. US GDP is almost $19 trillion. Is it growing or shrinking? If it’s growing … how rapidly? How might this information impact our daily financial and business decisions?
The objective of the SHI is simple: To predict the GDP direction ahead of official economic releases. While the objective is simple, the task is not. BEA publishes GDP figures the instant they’re available. Unfortunately, the data is old, old news; it’s a lagging indicator.
‘Personal consumption expenditures,’ or PCE, is the single largest component of the GDP. In fact, the majority of all US GDP increases (or declines) usually result from (increases or decreases in) consumer spending. Thus, this is clearly an important metric to track.
I intend the SHI is to be predictive, anticipating where the economy is going – not where it’s been. Thereby giving us the ability to take action early. Not when it’s too late.
Taking action: Keep up with this weekly BLOG update.
If the SHI index moves appreciably – either showing massive improvement or significant declines – indicating expanding economic strength or a potential recession, we’ll discuss possible actions at that time.
The BLOG:
My “R-words” are hard data. I’m referring to recovery, recession, and r-star.
You are familiar with the first two terms. Let me introduce the third: ‘r-star’ is the term economists use for the “natural rate of interest.” Going forward, let’s use r* for short.
What, precisely, is the natural rate of interest? In essence, it is a ‘long-run’ interest rate; one that would prevail a number of years into the future assuming the US economy was in an equilibrium state, operating at its full potential. I think of r* as an “equilibrium” interest rate – the rate we would expect if the economy was simply chugging along, neither expanding too quickly, nor shrinking.
Right now, as you’ll see in our discussion below, r* is quite low.
Recovery and recession, which I prefer to call ‘expansion’ and ‘contraction’ when discussing these terms in an economic or GDP framework, are always affected by interest rate movements. When the FED wishes to “juice” the economy, increasing the rate of expansion, they generally lower short-term rates. If they want to slow GDP growth, a rate-hike or two might do the trick. This is the typical FED playbook.
Today, John Williams is the President of the San Francisco FED.
In 2003, he was a mere ‘Senior Research Advisor.’ He’s come a long way. In October of that year, he published a paper entitled “The Natural Rate of Interest,” a topic in which he had great personal interest. (No pun intended. Well, OK, maybe a small one.)
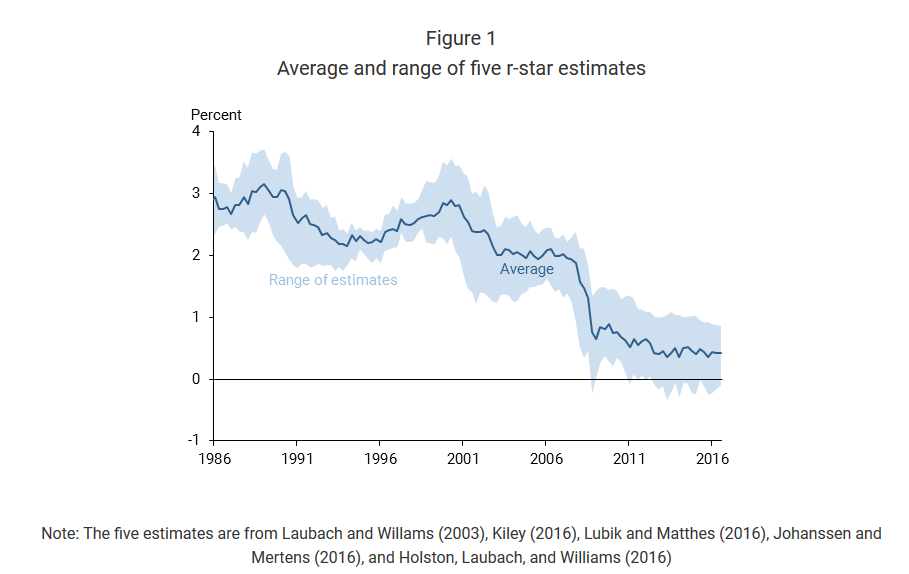
His latest economic letter, published in February of 2017, entitled “Three Questions on R-star,” returns to that theme. In the 15 or so years since Dr. Williams published his earlier research paper, r* has declined dramatically. Dr. William’s most recent comment on the issue states “…evidence suggests that low r-star is a global phenomenon, is likely to be very persistent, and is not confined only to safe assets.” http://www.frbsf.org/economic-research/publications/economic-letter/2017/february/three-questions-on-r-star-natural-rate-of-interest/
A number of other economic experts also study r*. It’s the consensus of five US economic expert teams that r* has plummeted to about 1/2 of a percent:
A few weeks ago, the St. Louis FED President, James Bullard, also presented an in-depth discussion on a related metric he called r† — a metric closely related to r* — but also the natural (real) rate of interest.
Dr. Bullard’s conclusion: “… the natural rate of interest, and hence the appropriate policy rate, is low and unlikely to change very much over the forecast horizon.”
His accompanying graphic, focused on the 1-year real yield, is similar in shape to the image above from Dr. Williams:
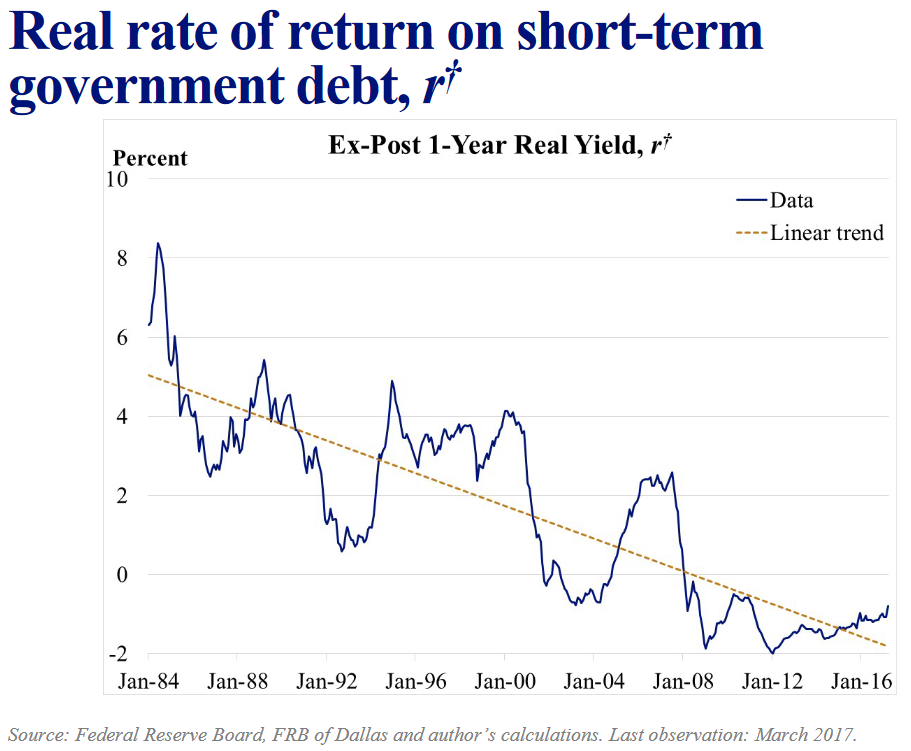
The linear trend since January of 1984 is clear: DOWN. And very, very low. In fact, below zero. In fact, the ‘real’ 1-year yield implied by Dr. Bullard’s graph above is about a negative 1%. (The current 1-year Treasury yield is 1.15%. As the ‘real’ rate is adjusted downward for inflation, the -1% rate is fairly accurate.)
In his graphic analysis (here’s the URL, if you’re interested: https://www.stlouisfed.org/~/media/Files/PDFs/Bullard/remarks/2017/Bullard_Amelia_Island_8_May_2017.pdf ), he presents a ‘hard data’ approach to calculating r†. Dr. Bullard believes r† is equal to the sum of three (3) components:
- Labor productivity;
- Labor force growth; and,
- Investor’s desire for safe assets.
Let me summarize without getting too much further into the weeds here. 🙂
Measured against historic numbers, both labor force growth and productivity are down significantly – but both remain positive. According to Dr. Bullard, however, the “desire for safe assets” has not:

Look at the red arrow. Dr. Bullard’s contention is amazing: In the last 20 or so years, investors have increasingly sought “safety” over return. And they’re willing to accept to a negative return in exchange for long-term asset value preservation. From a recent “high” in 2008 of zero, safe assets today are willing to accept a negative 3% to preserve their principal.
The implications of this change – if, in fact, it is a structural change – are many. I’ll focus on only one today: FED interest rate policy.
In a nutshell, assuming this decline in r* (or r†) is structural, and permanent, it suggests the FED, today, is facing a very real challenge. As Dr. Bullard suggested above, if the natural rate of interest is low and unlikely to change, then FED rate policy must change. Said another way, while the FED may wish to lift short term rates more often, to higher levels, they may be unable to. The number, and size, of increases may be constrained by the new, much lower, level of r*.
Why does a low natural interest rate restrict FED rate increases? In last week’s SHI update, we discussed how the FED can cause the yield curve to invert. (https://www.steakhouseindex.com/shi-update-52417-the-fed-and-the-steak-house/)
When the FED raises short-term rates, the left side of the yield curve lifts. In past economic theory, shortly thereafter, the long-end (the right end) of the yield curve typically will soon rise in response.
However, if long-term rates do not rise in tandem, the yield curve flattens. In a world of a very low r*, the long-end of the curve is likely to remain low. Longer rates will not move higher as easily, or the the extent, as it did in past FED rate increase cycles.
Thus, the FED has a greater challenge than usual: Too few rate hikes and the FED believes they risk the economy growing too fast; too many, and they may push the economy from recovery into recession.
Dr. Bullard was talking about precisely this issue. I think it is likely that FED rate increases, as a result, will be fewer and smaller than in past cycles.
Conclusion: Both short-term and long-term rates will remain lower, longer, than in the past. Probably significantly lower. And significantly longer.
I think that’s enough ‘hard data’ for one day. How is the SHI faring this week? Are “consumers of beef” still spending extravagantly? Is Mastros still in high demand? And how does this week’s SHI compare to the same week last year?
Well, this is a bit embarrassing: It appears I didn’t write an SHI blog during this week last year! I think I was traveling in France … without the requisite technology needed to compose the post. C’est la vie! Here is the blog post from the following week, June 8th: https://www.steakhouseindex.com/shi-update-june-8-2016/
Regardless, even without a 6/1/16 number, the SHI data trend we’re seeing now is quite interesting. Take a look:

Above, 6/1/16 shows as a blank, white box. But the 5/31/17 SHI reading is a whopping negative -27!
The trend comparison is fascinating: Last year at this time, SHI readings were fairly neutral. But this year is a very different story. Recently, our SHI readings have been extremely weak. In fact, at a -27, this week’s SHI is the lowest reading we’ve seen since tracking the data. Here is this week’s SHI grid:

If you and 3 friends are hankering for a Bone-In Rib-eye at Mastro’s, today’s your lucky day! OpenTable.com can get you in at 7:30 or 7:45 – two prime dinner slots. And “the world is your oyster” at our other three pricey eateries: Any time slot you wish is yours!
Is this trend meaningful? It very well could be. But before we get too excited, let’s see how next week’s SHI reading comes in. Last year, on June 8th, the SHI was a positive 4. If next week’s reading is similar to today’s, it might be time to think about lowering the lifeboats. Because, if that’s the case, the SHI may be forecasting a sinking US economy.
- Terry Liebman

2 Comments
Simply looked at several of your images (: i’m really glad i reached task darkness you.
You’re terrific!
I see your blog needs some unique articles.
Writing manually is time consuming, but there is solution for this hard task.
Just search for; Miftolo’s tools rewriter